

Codely v2.0 public release is here
Lorem ipsum dolor sit amet, consectetur adipiscing elit lobortis arcu enim urna adipiscing praesent velit viverra sit semper lorem eu cursus vel hendrerit elementum morbi curabitur etiam nibh justo, lorem aliquet donec sed sit mi dignissim at ante massa mattis.
- Neque sodales ut etiam sit amet nisl purus non tellus orci ac auctor
- Adipiscing elit ut aliquam purus sit amet viverra suspendisse potent i
- Mauris commodo quis imperdiet massa tincidunt nunc pulvinar
- Adipiscing elit ut aliquam purus sit amet viverra suspendisse potenti
What has changed in our latest release?
Vitae congue eu consequat ac felis placerat vestibulum lectus mauris ultrices cursus sit amet dictum sit amet justo donec enim diam porttitor lacus luctus accumsan tortor posuere praesent tristique magna sit amet purus gravida quis blandit turpis.
All new features available for all public channel users
At risus viverra adipiscing at in tellus integer feugiat nisl pretium fusce id velit ut tortor sagittis orci a scelerisque purus semper eget at lectus urna duis convallis. porta nibh venenatis cras sed felis eget neque laoreet suspendisse interdum consectetur libero id faucibus nisl donec pretium vulputate sapien nec sagittis aliquam nunc lobortis mattis aliquam faucibus purus in.
- Neque sodales ut etiam sit amet nisl purus non tellus orci ac auctor
- Adipiscing elit ut aliquam purus sit amet viverra suspendisse potenti
- Mauris commodo quis imperdiet massa tincidunt nunc pulvinar
- Adipiscing elit ut aliquam purus sit amet viverra suspendisse potenti
Coding collaboration with over 200 users at once
Nisi quis eleifend quam adipiscing vitae aliquet bibendum enim facilisis gravida neque. Velit euismod in pellentesque massa placerat volutpat lacus laoreet non curabitur gravida odio aenean sed adipiscing diam donec adipiscing tristique risus. amet est placerat in egestas erat imperdiet sed euismod nisi.
“Nisi quis eleifend quam adipiscing vitae aliquet bibendum enim facilisis gravida neque velit euismod in pellentesque massa placerat”
Real-time code save every 0.1 seconds
Eget lorem dolor sed viverra ipsum nunc aliquet bibendum felis donec et odio pellentesque diam volutpat commodo sed egestas aliquam sem fringilla ut morbi tincidunt augue interdum velit euismod eu tincidunt tortor aliquam nulla facilisi aenean sed adipiscing diam donec adipiscing ut lectus arcu bibendum at varius vel pharetra nibh venenatis cras sed felis eget dolor cosnectur drolo.
If you review every deal the same way, you waste time and miss better ones. I’d use a simple scoring system to rank deals by two things: upside and chance of closing.
Here’s the short version:
- I start with basic screening to remove obvious no-fits
- I score the remaining deals using the same inputs every time
- I look at financials, customer mix, seller response, and process status
- I use score bands like 75+, 50–74, and below 50 to decide next steps
- I update scores each week as new data comes in
- I backtest the model every 12 to 24 months
The article shows that tight deal markets leave little room for bad prioritization. It points to data like 26% lower lower-middle-market deal volume year over year, and a sharp drop in win rates when deals drag past 50 days: 47% for faster closes vs. 20% after that. The message is simple: rank deals early, act on the top ones fast, and stop letting weak deals eat your team’s time.
A good scoring model usually looks at four areas:
- Financial quality: revenue, growth, EBITDA or SDE, margin, price
- Fit: sector, geography, customer match
- Risk: customer concentration, key-person risk, legal issues
- Process: seller reply speed, data room status, deal momentum
I’d also keep the model strict about missing data. For example, if more than 40% of key fields are missing, I’d cap the score so thin deals don’t jump to the top on partial info.
Here’s the core idea in one view:
| Area | What I check | Why it matters |
|---|---|---|
| Financials | Revenue, growth, margin, price | Helps show deal quality |
| Fit | Industry, geography, buyer match | Helps show alignment with target profile |
| Risk | Concentration, team depth, legal exposure | Helps avoid weak deals |
| Process | Seller speed, documents, stage progress | Helps estimate close odds |
I’d treat this as a working system, not a one-time worksheet. High-score deals should move now. Mid-score deals should get follow-up and missing data requests. Low-score deals should stay out of the way unless new facts change the picture.
That’s the core playbook this guide lays out.
The Core Data Inputs That Should Drive Deal Priority
This stage is about structured intake, not full diligence. The goal is simple: gather enough information to rank deals the same way every time.
Financial, Operational, and Market Data That Signal Deal Quality
Only score deals that clear a basic financial floor. For the first pass, the must-have fields are:
- trailing 12-month (TTM) revenue
- year-over-year revenue growth
- EBITDA or seller's discretionary earnings (SDE)
- EBITDA margin
You can usually pull these from a teaser or a CIM summary.
Revenue quality matters just as much as revenue size. Deals with recurring revenue and low customer concentration should score better than businesses that lean on one-off projects or a small handful of customers. A common rule of thumb is to flag concentration risk when one customer makes up more than 10% of revenue, or when the top five customers together make up more than 25%. In SaaS, buyers often use a tighter cutoff. If the top three to five clients account for more than 30%–40% of ARR, that usually creates valuation risk.
On the operating side, the must-have fields are primary geography, industry niche, employee count, number of locations, and a few complexity signals like asset-heavy versus asset-light. These details are often in the listing headline or easy to confirm in a short broker call. They matter because they shape integration effort and strategic fit.
If you can get market data early, even better. Market growth, regulatory exposure, competitive position, and pricing power can help you tell the difference between a business that is strong and one that just looks polished on paper.
The table below separates the must-have fields from the nice-to-have ones:
| Data Category | Required for Initial Score | Optional |
|---|---|---|
| Financial | TTM revenue, YoY growth, EBITDA/SDE, EBITDA margin | Revenue by product line, gross margin, capex intensity, normalized working capital requirements |
| Customer quality | Top customer % of revenue, recurring vs. one-time revenue mix | Cohort retention, NRR, customer acquisition cost |
| Market & operations | Industry niche, geography, headcount, location count | Management bench depth, ERP/CRM systems, supplier concentration |
Seller and Process Signals That Affect Close Probability
Strong numbers help, but process signals often decide which deals move.
A seller with a clear 6–12 month exit timeline who answers within 24–48 hours is far more actionable than one who is only "exploring options" and takes a week to reply. That difference tells you a lot before diligence even starts.
Document readiness matters too. A deal with three years of financials and a TTM P&L already available is simply further along than one where even basic files are still pending. Inside your own pipeline, time in stage and meeting activity are just as useful. Deals that sit still should drop in rank. Deals with recent calls, management meetings, or site visits should move up.
How to Standardize and Capture Data Consistently
Set required fields that must be filled in before a deal gets scored. Then use standard pipeline stages with clear entry and exit rules:
New Listing → Contacted → Under NDA → Initial Call Complete → CIM Received → LOI Submitted
Industry labels should follow one taxonomy. Broad labels like "tech" or "services" sound simple, but they make cross-deal analysis messy fast. If one person logs a company as "software", another as "SaaS", and a third as "IT services", your scoring starts to drift. A good benchmark is at least 85% field completeness across active deals so the scoring stays dependable.
Cleaner inputs make scoring faster and easier to trust. Kumo pulls listings from multiple sources and exports structured deal data, which makes it easier to move records into a scoring sheet or CRM.
Once the inputs are standardized, assign weights and score bands.
sbb-itb-97ecd51
How to Build a Practical Deal Scoring Model
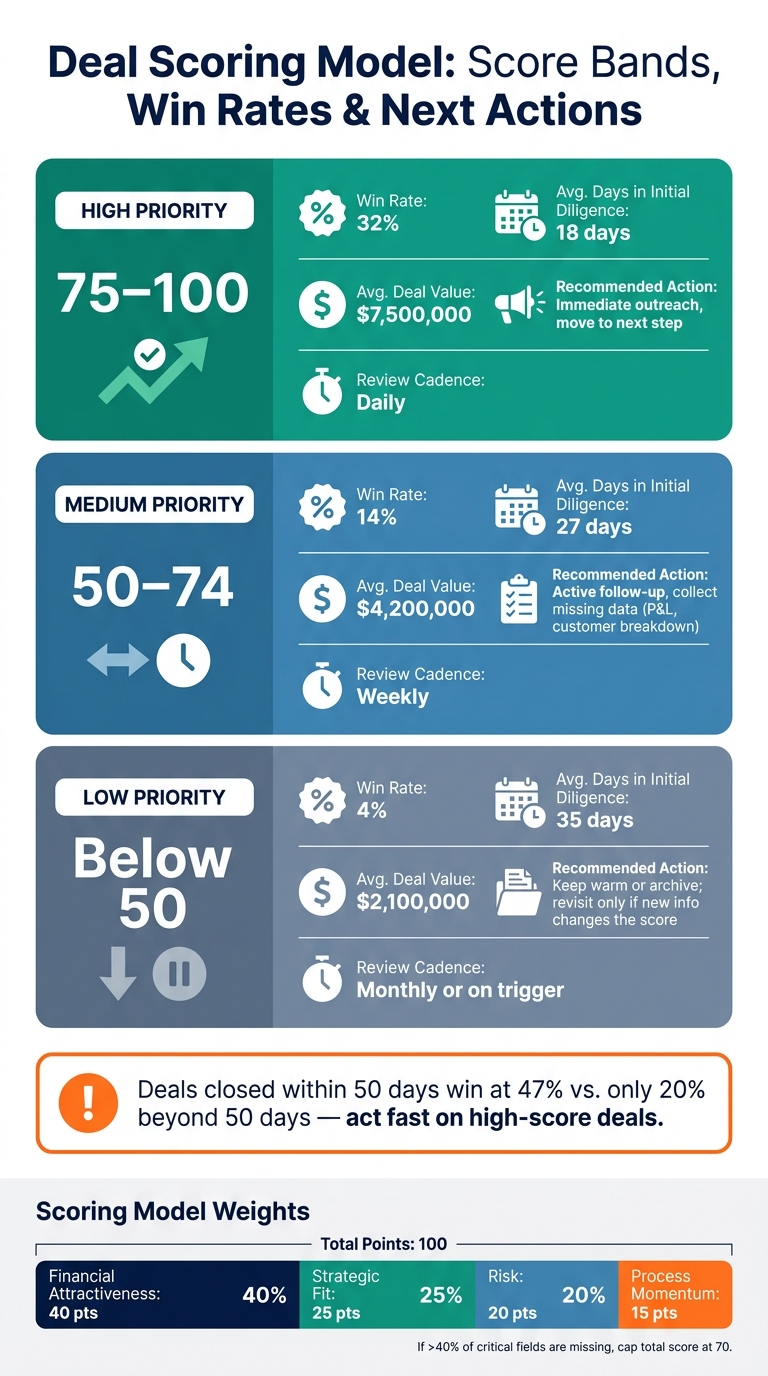
Deal Scoring Model: Score Bands, Win Rates & Actions
A practical deal scoring model turns the same set of inputs into one score you can use to rank deals by quality and close probability.
The simplest way to start is with a 40/25/20/15 split across financial attractiveness, strategic fit, risk, and process momentum. Here, process momentum means how likely the deal is to keep moving. The score is the sum of weighted criterion points.
| Criterion Bucket | Sub-Criterion | Point Range |
|---|---|---|
| Financial attractiveness (40 pts) | EBITDA margin | 0–10 pts (10: ≥25%; 7: 15–24%; 4: 10–14%; 0–2: <10%) |
| YoY revenue growth | 0–10 pts (10: ≥20%; 7: 10–19%; 4: 5–9%; 0–2: <5%) | |
| Revenue scale (TTM) | 0–10 pts (10: >$10M; 7: $3–10M; 4: $1–3M; 0: <$1M) | |
| Purchase price vs. target multiple | 0–10 pts (10: at/below target; 5: slight premium; 0: well above) | |
| Strategic fit (25 pts) | Industry and sub-vertical match | 0–10 pts (10: top-priority sector; 5: adjacent; 0: non-core) |
| Geography/serviceability | 0–5 pts (5: core U.S. regions; 2–3: secondary; 0: out-of-scope) | |
| Customer/segment overlap | 0–10 pts (10: strong overlap; 0: little/no overlap) | |
| Risk (20 pts) | Customer concentration | 0–6 pts (6: top customer <20%; 3: 20–39%; 0: ≥40%) |
| Key-person dependency | 0–6 pts (6: strong team depth; 3: mixed; 0: single key-person risk) | |
| Regulatory and legal exposure | 0–8 pts (8: low; 4: manageable; 0: heavy or unclear) | |
| Process momentum (15 pts) | Seller responsiveness | 0–6 pts (6: <24 hr replies; 3: 1–3 days; 0: sporadic) |
| Data room completeness | 0–6 pts (6: full data room; 3: CIM only; 0: teaser only) | |
| Process speed | 0–3 pts (3: clear process; 1–2: fuzzy; 0: red-flag rush) |
If more than 40% of critical fields are missing, cap the total score at 70. That one rule helps keep thin, half-documented deals from floating to the top just because a few known data points look good.
Set Scoring Criteria, Weights, and Score Bands
The point of scoring is not to make the model look polished. It’s to reflect how your team says yes or no in practice.
If you already know certain traits drive your decisions, bake that into the weights. For example, if price discipline matters more than fast seller replies, your scoring should show that. If customer overlap can make or break a deal, don’t bury it in a low-point sub-criterion.
A good gut check: if the investment memo says the target is $2–$8M EBITDA B2B services with recurring revenue in the U.S. Midwest, then the scorecard should mirror that. Weight each factor based on how often it changes the outcome, not how nice it sounds in a pitch deck.
Adjust the Model by Buyer Type and Acquisition Strategy
Buyer type should change the weighting. A strategic acquirer and a financial buyer do not look at the same deal through the same lens.
For a corporate strategic buyer, strategic fit may deserve 40–50 points, while financial attractiveness may drop to 25–30 points. Risk should also cover integration issues more directly, including IT stack compatibility, overlapping customer bases, and cultural alignment.
For a financial buyer - such as an independent sponsor, searcher, or lower-middle-market PE fund - financial attractiveness often moves up to 50–60 points. Risk usually lands at 20–25 points, while strategic fit narrows to 10–15 points. Process momentum often stays at 10–15 points.
That shift matters. A strategic buyer may accept a tighter valuation if the target fills a gap in geography or customer mix. A financial buyer, by contrast, is more likely to focus on margin, growth, price, and downside protection.
Translate Score Bands into Next Actions
Once the score is set, tie each range to a clear next move. Use 75+ for high, 50–74 for medium, and below 50 for low.
| Score Band | Priority Level | Recommended Action | Review Cadence |
|---|---|---|---|
| 75–100 | High | Immediate outreach and move to the next step | Daily |
| 50–74 | Medium | Active follow-up and collect missing data (P&L, customer breakdown) | Weekly |
| Below 50 | Low | Keep warm or archive; revisit only if new information changes the score | Monthly or on trigger |
This part should be dead simple. High-score deals get pushed forward now. Mid-range deals stay alive, but only with a clear plan to fill gaps. Low-score deals do not eat up team time unless something new changes the picture.
There’s a timing reason for this too: deals closed within 50 days win at 47%, versus 20% beyond 50 days. So each score band should connect to a next action, not just a label in a spreadsheet.
Use these bands to build weekly priority views.
How to Use Scores in Weekly Pipeline Management
Weekly reviews make the score useful. The number matters only when it tells your team what to do next and how soon to do it.
Create Priority Views for High-, Medium-, and Low-Score Deals
Set up three saved views in your CRM or deal platform, one for each score band:
- High priority: 75–100
- Medium priority: 50–74
- Low priority: below 50
Each view should show the same core fields: score, estimated deal value ($), current stage, days in stage, last activity date, assigned owner, and any missing-data flags. That includes flags like financials missing, no seller call, or incomplete documents.
High-score deals should go straight to partner review and fast outreach. If a deal scores high but key data is still missing, leave it in the high-priority view and add a clear flag. That way, the team knows the deal looks strong, but the score should not be treated as final yet.
Seller responsiveness can also change the pecking order. A medium-score deal can move up for a while if the seller replies within hours and sends financials without being chased. On the flip side, a high-score deal with no seller response for 30+ days may need to move down. In plain English: the view logic should match what's happening now, not just the first score on the page.
Track Conversion, Time in Stage, and Resource Allocation by Score Band
These shifts help you test whether the score lines up with speed, value, and close rate. At a minimum, track win rate, average days in initial diligence, and average deal value ($) for each score band over a trailing 12-month period.
| Score Band | Win Rate | Avg. Days in Initial Diligence | Avg. Deal Value ($) |
|---|---|---|---|
| High (75–100) | 32% | 18 days | $7,500,000 |
| Medium (50–74) | 14% | 27 days | $4,200,000 |
| Low (Below 50) | 4% | 35 days | $2,100,000 |
Use this pattern as a benchmark. If your numbers look far off, go back and adjust the weights instead of throwing out scoring entirely.
Most diligence time should go to high-score deals. About a quarter should go to medium-score deals, and low-score deals should get only light attention. Then compare that time split with closed deal value to see if the effort is paying off.
Use Kumo Data and Alerts to Keep Priority Rankings Current

Rankings shift as new data comes in, so alerts help keep the weekly view up to date. Kumo sends alerts when a listing changes, whether that's a price reduction, updated financials, or new documents added. A price cut, for example, can improve the valuation-related sub-score and push a deal into a higher-priority band.
Kumo's custom search filters can also match your scoring model. You can filter by revenue range, EBITDA margin, industry, and U.S. state, so new listings that fit your criteria show up on their own instead of forcing your team to hunt them down by hand.
In the weekly pipeline meeting, review alerts, recalculate any affected scores, and move deals between priority bands as needed.
Improve the Model Over Time and Avoid Common Mistakes
Backtest Past Deals and Update Weights Every 12 to 24 Months
Weekly reviews tell you which deals moved. Backtesting tells you whether the model still picks the right deals.
A scoring model that never changes will stop doing its job well. Backtest it every 12 to 24 months, or earlier after big shifts in interest rates, strategy, or sourcing.
Pull closed-won, closed-lost, and abandoned deals from the last 12 to 24 months. Use at least 50 to 100 deals. Then compare results across your score bands:
- Close rates
- Average time to close
- Average deal size in USD
The point is simple: high-score deals should lead to better outcomes, not just move through review faster. If high-score deals aren't closing at higher rates than medium-score deals, your weights need work.
Look closely at the deals the model got wrong. Low-score winners and high-score failures are where the cracks show. Those outliers usually point to variables the model is misreading or missing.
When market conditions change, update weights with intent. If borrowing costs go up, put more weight on margin, cash flow stability, and interest coverage. If better data starts showing up earlier in the process, add more weight to source channel, listing completeness, and data richness.
Don't make those changes casually. Write down why each weight changed. Run a what-if check on recent historical deals so you can see how the new logic would have changed ranking and priority. Then share the new rules with everyone involved in pipeline reviews.
If the model still misses obvious winners or losers after backtesting, you have a clear next step: either tighten the rules or consider adding a predictive layer.
Rules-Based Scoring vs. Advanced Predictive Models
For most small and mid-sized U.S. acquisition teams, a rules-based model is enough. It's transparent, easy to edit, and doesn't take much upkeep. Machine learning makes more sense only when you have enough scored deals, clean structured data, and enough volume that manual ranking starts slowing the team down.
Use the table below to choose the right fit:
| Aspect | Rules-Based (Spreadsheet/CRM) | Predictive ML Model |
|---|---|---|
| Data requirements | Low; works with limited history | High; typically needs large historical datasets with labeled outcomes |
| Transparency | High; every weight is visible and editable | Lower; requires explainability tools to interpret |
| Maintenance | Manual updates once or twice a year | Periodic retraining needed to avoid model drift |
| Best fit | Small to mid-sized buyers, search funds, independent sponsors | Large PE firms, corporate buyers, aggregators with high deal volume |
Use predictive models only if they improve prioritization enough to justify the added complexity. That's the trade-off.
Many larger teams use a hybrid approach. The rules-based score sets the floor, and a predictive layer adds risk flags or uplift scores on top. That setup keeps the model explainable while also picking up patterns manual rules can miss.
Conclusion: Build a System That Ranks Deals, Not Just Collects Them
Once the model is calibrated, the next job is keeping it current and usable. A strong prioritization system depends on clean inputs, clear weights, score bands tied to action, and regular backtesting.
Maintain it. Backtest it on schedule. Route attention by score band.
The goal isn't more deal flow. It's faster, better decisions on the deals most likely to close.
FAQs
How do I choose the right scoring weights for my team?
Start by defining your acquisition goals and the metrics that matter most for your strategy. Then build a balanced scorecard and assign weights to the main categories you want to judge, such as financial health, market position, and operational fit.
For example, you might give 40% to financial health and 30% each to market position and operational fit. Review those weights on a regular basis and adjust them as your goals shift and market conditions change.
What should I do when a deal has missing data?
When a deal comes in with gaps or messy fields, a deal sourcing platform like Kumo can help clean things up. It standardizes the data, pulls details from different sources, and turns them into one more reliable dataset.
AI-driven tools can also merge and check listings on their own. That helps fill in missing details and makes prioritization and financial analysis more accurate and easier to compare across deals.
When should I move from rules-based scoring to a predictive model?
Move from rules-based scoring to a predictive model when static, manual criteria stop giving you enough insight into likely deal outcomes and risk.
Rules-based scoring works well for basic filtering. But predictive models go further. They use historical and real-time data to find patterns, anomalies, and trends that simple scoring can miss.
This shift matters most later in the acquisition process, when decisions get messier and the stakes get higher. At that point, you often need to weigh more complex factors with tighter precision.