

Codely v2.0 public release is here
Lorem ipsum dolor sit amet, consectetur adipiscing elit lobortis arcu enim urna adipiscing praesent velit viverra sit semper lorem eu cursus vel hendrerit elementum morbi curabitur etiam nibh justo, lorem aliquet donec sed sit mi dignissim at ante massa mattis.
- Neque sodales ut etiam sit amet nisl purus non tellus orci ac auctor
- Adipiscing elit ut aliquam purus sit amet viverra suspendisse potent i
- Mauris commodo quis imperdiet massa tincidunt nunc pulvinar
- Adipiscing elit ut aliquam purus sit amet viverra suspendisse potenti
What has changed in our latest release?
Vitae congue eu consequat ac felis placerat vestibulum lectus mauris ultrices cursus sit amet dictum sit amet justo donec enim diam porttitor lacus luctus accumsan tortor posuere praesent tristique magna sit amet purus gravida quis blandit turpis.
All new features available for all public channel users
At risus viverra adipiscing at in tellus integer feugiat nisl pretium fusce id velit ut tortor sagittis orci a scelerisque purus semper eget at lectus urna duis convallis. porta nibh venenatis cras sed felis eget neque laoreet suspendisse interdum consectetur libero id faucibus nisl donec pretium vulputate sapien nec sagittis aliquam nunc lobortis mattis aliquam faucibus purus in.
- Neque sodales ut etiam sit amet nisl purus non tellus orci ac auctor
- Adipiscing elit ut aliquam purus sit amet viverra suspendisse potenti
- Mauris commodo quis imperdiet massa tincidunt nunc pulvinar
- Adipiscing elit ut aliquam purus sit amet viverra suspendisse potenti
Coding collaboration with over 200 users at once
Nisi quis eleifend quam adipiscing vitae aliquet bibendum enim facilisis gravida neque. Velit euismod in pellentesque massa placerat volutpat lacus laoreet non curabitur gravida odio aenean sed adipiscing diam donec adipiscing tristique risus. amet est placerat in egestas erat imperdiet sed euismod nisi.
“Nisi quis eleifend quam adipiscing vitae aliquet bibendum enim facilisis gravida neque velit euismod in pellentesque massa placerat”
Real-time code save every 0.1 seconds
Eget lorem dolor sed viverra ipsum nunc aliquet bibendum felis donec et odio pellentesque diam volutpat commodo sed egestas aliquam sem fringilla ut morbi tincidunt augue interdum velit euismod eu tincidunt tortor aliquam nulla facilisi aenean sed adipiscing diam donec adipiscing ut lectus arcu bibendum at varius vel pharetra nibh venenatis cras sed felis eget dolor cosnectur drolo.
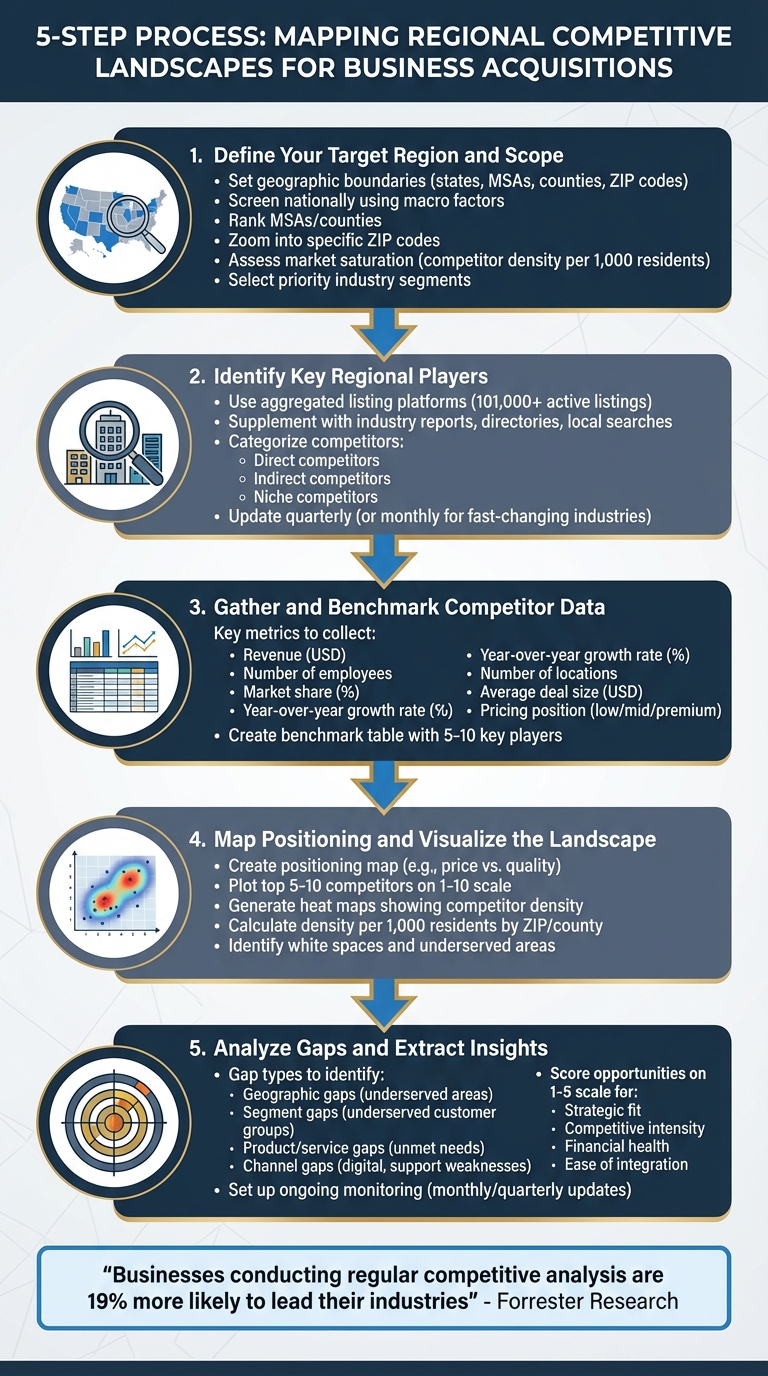
Want to make smarter business acquisitions? Start with a regional competitive landscape map. This process helps you pinpoint market opportunities, understand competitor dynamics, and avoid saturated areas. Here's a quick breakdown of the five steps:
- Define Your Target Region and Scope: Set geographic boundaries (e.g., states, MSAs, ZIP codes) and prioritize industry segments based on growth, profitability, and alignment with your goals.
- Identify Key Regional Players: Use tools like Kumo to compile and categorize competitors - direct, indirect, and niche - based on their offerings and market presence.
- Gather and Benchmark Competitor Data: Collect standardized metrics (e.g., revenue, market share, growth rates) to compare competitors effectively.
- Map Positioning and Visualize the Landscape: Create positioning and heat maps to identify market gaps and underserved areas.
- Analyze Gaps and Extract Insights: Turn gaps into actionable acquisition strategies, focusing on geographic, segment, product, and channel opportunities.
This structured approach ensures you stay ahead of shifting market dynamics and make data-driven decisions for acquisitions and growth.
5 Steps to Map Regional Competitive Landscapes for Business Acquisitions
Step 1: Define Your Target Region and Scope
Set Geographic Boundaries
Start by outlining the geographic area you want to focus on. This could be based on states, metropolitan statistical areas (MSAs), counties, or even ZIP codes. For instance, a local urgent care business might focus on Florida’s Miami and Orlando MSAs, targeting areas within a 20-minute drive of key residential neighborhoods. On the other hand, multi-unit acquirers, such as quick-service restaurants, might define their scope as "contiguous counties within a 2-hour drive of existing hub locations" to maintain operational efficiency.
Begin with a broad screening at the national or multi-state level, using macro factors like states with above-average industry growth, annual population growth exceeding 2%, or median income above the national median. This helps narrow the list to 5–10 potential regions. Next, rank MSAs or counties based on factors like customer density, competitor density, and growth trends to identify 3–5 top-tier regions. Finally, zoom in on specific ZIP codes or neighborhoods for precise targeting.
Assess market saturation by analyzing competitor density - measuring locations per 1,000 residents and per square mile - and comparing these figures to demand indicators like population size, business count, or median household income. Heat maps can be particularly useful here, as they highlight areas with heavy competition versus those with lighter coverage. If a region shows high saturation and low growth, it might not be ideal for new market entry but could still offer opportunities for acquisitions aimed at consolidation.
Once you’ve defined your geographic boundaries, the next step is to refine your focus by identifying industry segments that align with your strategic goals.
Select Priority Industry Segments
Focus on industry segments that best support your strategic objectives and regional performance. Evaluate factors like historical growth rates, profitability trends, market fragmentation, and regulatory considerations using tools like public registries, industry reports, and commercial datasets. It’s also important to consider how these segments align with your acquisition strategy, such as targeting businesses with recurring revenue models versus those relying on project-based work.
Platforms like Kumo can simplify this process by aggregating over 101,000 active business listings from various brokerages and marketplaces. This allows you to filter by industry, geography, and financial metrics like EBITDA or asking price. Such insights help you identify segments with a healthy pipeline of opportunities, understand valuation trends, and pinpoint where listings are geographically concentrated.
For example, a well-defined scope might be: “Owner-operated HVAC and plumbing services with $2 million–$10 million in annual revenue within the Dallas–Fort Worth MSA, focusing on ZIP codes with median household incomes above $70,000 and population densities over 1,000 per square mile.” This level of specificity ensures that your efforts are targeted and aligned with actionable opportunities.
Step 2: Identify Key Regional Players
Use Aggregated Listings and Tools
After defining your target region and industry, the next step is to compile a comprehensive list of relevant competitors. Relying on manual searches across directories, broker sites, and marketplaces can be time-consuming and prone to errors. This is where aggregated platforms come in handy.
Kumo simplifies this process by pulling together over 101,000 active business listings from thousands of brokers and hundreds of marketplaces into one interface. With Kumo, you can apply geographic filters - down to specific U.S. states or metro areas - and refine results using criteria like revenue range, industry code, and business model. For instance, if you're researching HVAC competitors in the Dallas–Fort Worth area, you can filter for "HVAC services" within a $2 million–$10 million revenue range. The platform even allows you to export the results into a spreadsheet or CRM for further analysis. Its AI-generated summaries condense each listing into easy-to-digest bullet points, letting you review multiple businesses in minutes rather than hours. This structured approach lays the groundwork for a focused regional analysis.
To ensure you cover all bases, supplement Kumo's data with other sources. These include industry reports, local chambers of commerce, trade associations, government registries, and grassroots methods like Google "near me" searches, Yelp reviews, local directories, and maps. Cross-referencing these sources in a central spreadsheet - assigning each competitor a unique ID - helps create a robust and reliable database.
For ongoing updates, take advantage of Kumo’s geo-filtered search alerts, track local search results, and set up keyword-based news notifications. Update your competitor list quarterly, or monthly if you're in a fast-changing industry. Once your list is updated, classify competitors to better focus your strategy.
Categorize Competitors
A long, unorganized list of competitors won’t provide much clarity. To gain actionable insights, group competitors into categories that highlight where you face direct competition, substitution threats, or niche challenges. Here’s a simple way to break it down:
- Direct competitors: These are businesses offering nearly identical products or services to the same customer base in your target region. For example, two residential HVAC companies serving the same ZIP codes would fall into this category.
- Indirect competitors: These companies solve the same customer problem but through different solutions or business models. Think of DIY home-improvement retailers or subscription-based filter services competing for the same household budget as an HVAC company.
- Niche competitors: These players specialize in a particular segment, feature, or vertical. For instance, an HVAC firm focusing solely on commercial high-rise systems or eco-friendly retrofits would fit here.
Add a "Competitor Type" column to your spreadsheet and label each company as Direct, Indirect, or Niche. Document the criteria for these categories in the spreadsheet header for consistency. Review websites, product offerings, and customer bases to assign accurate tags, and consider having a second person validate the classifications for key competitors to minimize bias. Filtered views based on these categories will make it easier to zero in on specific groups, such as all direct competitors in a city or niche players in a vertical.
To identify local market leaders, enhance your list with performance and presence indicators. Look for factors like the number of locations, service coverage, brand visibility in local search results and reviews, market share, growth rate, and marketing efforts. Rank competitors on a 1–5 scale for these attributes to quickly highlight top-tier players for deeper analysis.
Step 3: Gather and Benchmark Competitor Data
Key Data Points to Collect
After identifying and categorizing your regional competitors, the next step is to gather standardized data that allows for meaningful comparisons. For each competitor, collect essential company details like their name, ownership type, estimated revenue (in USD), number of employees, years in operation, and funding status. Add operational metrics such as the number of locations in your target region, key customer segments, flagship products or services, and pricing tiers. On top of that, track performance indicators like estimated market share, year-over-year growth rate, average deal size (in USD), and the percentage of revenue coming from the target region versus other areas.
For private companies, you’ll need to dig a little deeper. Use multiple sources to estimate figures - business databases, local registries, industry reports, and even news articles can provide revenue ranges and growth trends. Other useful insights can come from websites, job postings, and press releases, which may reveal hiring trends, new locations, or strategic priorities. Customer reviews and social media can also hint at order volumes or deal size patterns. If exact numbers aren’t available, use ranges and make notes about the source and your confidence level.
Tools like Kumo can simplify the process by offering structured data exports with consistent fields, such as asking price, revenue, cash flow, location, and deal size (in USD). Over time, this builds a reliable dataset that includes key metrics like average transaction sizes, valuation multiples, and acquisition activity. Once your data is standardized, you can organize it into a benchmark table, making direct comparisons much easier.
Benchmark Competitors
With your data collected and standardized, the next step is to convert it into actionable benchmarks. This involves creating a benchmark table where each row represents a competitor and each column corresponds to a specific metric. Key columns might include company name, primary customer segment, number of regional locations, estimated regional revenue (in USD), regional market share (percentage), average deal size (in USD), customer segments served, year-over-year growth rate (percentage), pricing position (low, mid, or premium), and any notable strengths or weaknesses. Keeping your list of competitors manageable - around 5 to 10 key players - ensures the data remains clear and actionable. Visual aids like conditional formatting can help highlight top-performing metrics at a glance.
To ensure consistency, define a data dictionary at the outset. For example, specify that “regional revenue” refers to revenue from customers whose billing addresses are in the target region, measured in USD over the last 12 months. Normalize all data by converting values to USD, aligning time periods, and standardizing labels. For missing or uncertain data, flag it, use ranges, or rely on proxies like headcount or visible customer volume. This structured, methodical approach turns scattered information into a valuable intelligence resource, helping you refine your market entry strategies, adjust pricing, and even identify acquisition opportunities in your target region.
Step 4: Map Positioning and Visualize the Landscape
Create a Positioning Map
After benchmarking your competitors, it’s time to transform that data into a visual representation - a positioning map. This tool helps you plot competitors on a graph using two dimensions that matter most to customers. Common pairings include price versus quality, market presence versus growth potential, or innovation versus reliability. The idea is to pinpoint where each competitor stands and identify clusters or gaps.
First, choose the two dimensions that best reflect customer buying behavior in your market. For example, if you’re analyzing fast-food chains in the Southeast U.S., you might use price (low to high) on the X-axis and health focus (low to high) on the Y-axis. Using your benchmark data - like market share percentages or customer ratings - score each of your top 5 to 10 competitors on a 1-10 scale for both dimensions. Then, plot these scores on a scatter chart, labeling each competitor. This gives you a clear picture of the competitive landscape and helps you understand where opportunities might lie.
For regional analysis, geospatial maps can offer additional insights. Plot competitor locations - stores, branches, or distribution centers - on a map of your target area. Then calculate competitor density per 1,000 residents by ZIP code or county. Heat maps are especially helpful here, as they highlight saturated areas versus those with thinner coverage. Tools like Kumo make this process easier by aggregating data from over 100,000 business listings with advanced filters. This allows you to visualize which businesses are available for acquisition in specific regions. These spatial insights can reveal untapped areas and prepare you for identifying market gaps.
Identify Underserved Market Gaps
With your positioning map ready, you can now analyze the data for areas of untapped potential. Look for empty spaces or underrepresented areas on the map - these “white spaces” often indicate unmet demand or opportunities for acquisitions. For instance, if most competitors are clustered in the low-price, low-health quadrant, but the affordable healthy options quadrant is empty, that could signal a niche worth targeting.
On geospatial maps, focus on regions where competitor density is below industry norms - such as fewer than 2 outlets per 1,000 residents in a given county. Cross-check these findings with demographic data, like population growth or median income, to determine if the gap represents an actual opportunity or simply low demand. Tools like Kumo can even alert you when businesses in these underserved areas become available for acquisition. By combining insights from both positioning maps and geographic density analysis, you’ll have a clear and actionable strategy for regional expansion or acquisitions.
sbb-itb-97ecd51
Step 5: Analyze Gaps and Extract Insights
Identify Acquisition Opportunities
Once you've created your positioning map, the next step is to turn those visual gaps into actionable acquisition strategies. Start by defining clear screening criteria, such as target regions (specific metro areas or states), deal size (e.g., $1,000,000–$10,000,000 total enterprise value), industry focus, profitability thresholds, and risk tolerance. For example, if you've identified underserved industrial services in the Southeast or fragmented auto repair shops in smaller Midwest cities, list businesses that meet your financial and strategic criteria.
To prioritize, score each potential acquisition candidate on factors like strategic fit, competitive intensity, financial health, and ease of integration, using a simple 1–5 scale. This scoring system helps you rank opportunities and build a focused acquisition pipeline. For instance, a mid-market buyer targeting auto repair services in Midwest cities with populations of 100,000–250,000 might notice a high density of vehicles but mostly single-location operators. This insight could lead to a roll-up strategy: acquiring 5–10 shops over three years, unifying operations, and rebranding them under a single name.
There are four key gap types to analyze:
- Geographic gaps: Areas with significant demand but few competitors, such as specific cities or ZIP codes.
- Segment gaps: Customer groups or deal sizes that are underserved.
- Product/service gaps: Needs frequently mentioned in customer reviews that competitors fail to address.
- Channel gaps: Weaknesses like missing digital presence, slow response times, or lack of local support.
Cross-check these findings with demographic data like population growth, median income, and business density to confirm that the gaps represent opportunity rather than just low demand. And don't stop there - keep monitoring market shifts to ensure your strategies remain relevant.
Use AI-Powered Tools for Monitoring
To keep your acquisition pipeline aligned with evolving market conditions, make monitoring an ongoing process. Your competitive map isn't a one-and-done document - it needs regular updates to reflect changes like new competitors, pricing adjustments, or new businesses entering the market. Set up a routine to review and refresh your data monthly or quarterly. Track metrics like competitor entries and exits, shifts in competitor positioning, changes in listing volume and valuations, and your win-loss trends across regions and segments.
AI-powered platforms like Kumo can make this process much easier. Tools like Kumo provide real-time alerts and analytics, helping you stay on top of market changes. For example, you can set custom filters to track opportunities in specific gaps, such as "service businesses in underpenetrated ZIP codes within 50 miles of Dallas with $2,000,000–$5,000,000 in revenue." Daily deal alerts notify you when new opportunities appear in your priority areas, turning your map into a living, dynamic resource.
These tools also offer analytics on listing volume, pricing trends, and time-on-market, helping you distinguish actionable opportunities from theoretical ones. If metrics show a region is heating up - more listings, rising prices, or new entrants - you can decide whether to speed up acquisitions, focus on organic growth, or pivot to less competitive areas.
How to Do a Competitive Landscape Analysis 2025
Conclusion
Turning scattered data into actionable acquisition strategies starts with mapping regional competitive landscapes. By following the five steps - defining your geographic scope, identifying key players, benchmarking data, visualizing positioning, and analyzing gaps - you can uncover opportunities that drive growth. According to Forrester Research, businesses that regularly conduct competitive analysis are 19% more likely to lead their industries, reinforcing the value of this structured approach.
Success hinges on disciplined execution. Without clear boundaries in Step 1, you risk wasting resources on irrelevant targets. Skipping Step 2's categorization leaves indirect competitors unnoticed. Failing to benchmark in Step 3 means losing sight of your standing in the market. Overlooking Step 4's visual mapping could mean missing hidden opportunities, while neglecting Step 5's ongoing monitoring renders your analysis outdated as the market evolves.
For acquisition professionals - whether you're part of a search fund, private equity firm, or corporate M&A team - speed and precision are critical. Manually tracking thousands of brokers and hundreds of websites is both time-consuming and inefficient. Tools like Kumo simplify this process by aggregating over 101,000 active business listings into a single searchable database. With AI-powered features that clean data, remove duplicates, and surface relevant targets in seconds, platforms like this streamline Steps 2 and 3. Custom filters for geography, industry, and financial metrics (like EBITDA or asking price in USD) help refine searches, while daily alerts ensure Step 5's monitoring stays on track. This efficiency not only saves time but also sharpens your competitive edge.
A real-world example highlights the impact of these methods: during a U.S. Midwest manufacturing analysis, firms identified a gap in mid-tier suppliers using positioning maps. This insight led to a $5,000,000 acquisition that increased market share by 15% within a year. It’s a clear demonstration of how combining visual mapping with SWOT benchmarking can deliver tangible results.
To stay ahead, revisit your regional map quarterly to monitor competitor movements, pricing shifts, and new market entrants. Markets are always changing, but with the right tools and a disciplined five-step process, you’ll consistently identify opportunities others overlook, turning regional insights into profitable acquisitions. This approach transforms raw data into a competitive edge that drives measurable success.
FAQs
How do I determine the best geographic boundaries for my competitive landscape map?
When setting geographic boundaries, it’s important to zero in on areas that matter most to your target audience and align with your business objectives. Begin by examining where your customers are concentrated and identifying regions where your competitors are particularly active. Factors like population density, economic activity, and regional patterns can guide you in shaping boundaries that resonate with your industry’s priorities.
Leverage tools that offer data-driven insights to pinpoint regions with untapped potential or significant deal activity. This approach ensures your map highlights the most strategic zones for growth and competitive evaluation.
What are the best ways to quickly identify key competitors in a specific region?
To pinpoint key competitors in your area more effectively, look into tools that compile business listings from various sources. Platforms equipped with AI-driven features and flexible search filters can make this task much simpler by helping you focus on the most relevant opportunities. You can also set up alerts for new developments and use data analytics to monitor trends and spot market gaps. These strategies not only save time but also offer meaningful insights into your competitive environment.
How can I turn market gaps into actionable acquisition strategies?
To transform market gaps into actionable acquisition strategies, begin by thoroughly analyzing these gaps. Look for industries, company sizes, or regions that align with your business objectives. Establish clear criteria for potential acquisitions - consider factors like revenue size, growth potential, or how well the company complements your existing operations. Once you’ve identified opportunities, prioritize them based on their potential impact and practicality.
From there, create a detailed plan outlining each step of the process, including outreach, due diligence, and integration. Leverage data analytics tools to monitor your progress and fine-tune your approach as needed. Tools like Kumo can simplify this process by consolidating business listings and offering valuable insights to help you make well-informed decisions.