

Codely v2.0 public release is here
Lorem ipsum dolor sit amet, consectetur adipiscing elit lobortis arcu enim urna adipiscing praesent velit viverra sit semper lorem eu cursus vel hendrerit elementum morbi curabitur etiam nibh justo, lorem aliquet donec sed sit mi dignissim at ante massa mattis.
- Neque sodales ut etiam sit amet nisl purus non tellus orci ac auctor
- Adipiscing elit ut aliquam purus sit amet viverra suspendisse potent i
- Mauris commodo quis imperdiet massa tincidunt nunc pulvinar
- Adipiscing elit ut aliquam purus sit amet viverra suspendisse potenti
What has changed in our latest release?
Vitae congue eu consequat ac felis placerat vestibulum lectus mauris ultrices cursus sit amet dictum sit amet justo donec enim diam porttitor lacus luctus accumsan tortor posuere praesent tristique magna sit amet purus gravida quis blandit turpis.
All new features available for all public channel users
At risus viverra adipiscing at in tellus integer feugiat nisl pretium fusce id velit ut tortor sagittis orci a scelerisque purus semper eget at lectus urna duis convallis. porta nibh venenatis cras sed felis eget neque laoreet suspendisse interdum consectetur libero id faucibus nisl donec pretium vulputate sapien nec sagittis aliquam nunc lobortis mattis aliquam faucibus purus in.
- Neque sodales ut etiam sit amet nisl purus non tellus orci ac auctor
- Adipiscing elit ut aliquam purus sit amet viverra suspendisse potenti
- Mauris commodo quis imperdiet massa tincidunt nunc pulvinar
- Adipiscing elit ut aliquam purus sit amet viverra suspendisse potenti
Coding collaboration with over 200 users at once
Nisi quis eleifend quam adipiscing vitae aliquet bibendum enim facilisis gravida neque. Velit euismod in pellentesque massa placerat volutpat lacus laoreet non curabitur gravida odio aenean sed adipiscing diam donec adipiscing tristique risus. amet est placerat in egestas erat imperdiet sed euismod nisi.
“Nisi quis eleifend quam adipiscing vitae aliquet bibendum enim facilisis gravida neque velit euismod in pellentesque massa placerat”
Real-time code save every 0.1 seconds
Eget lorem dolor sed viverra ipsum nunc aliquet bibendum felis donec et odio pellentesque diam volutpat commodo sed egestas aliquam sem fringilla ut morbi tincidunt augue interdum velit euismod eu tincidunt tortor aliquam nulla facilisi aenean sed adipiscing diam donec adipiscing ut lectus arcu bibendum at varius vel pharetra nibh venenatis cras sed felis eget dolor cosnectur drolo.
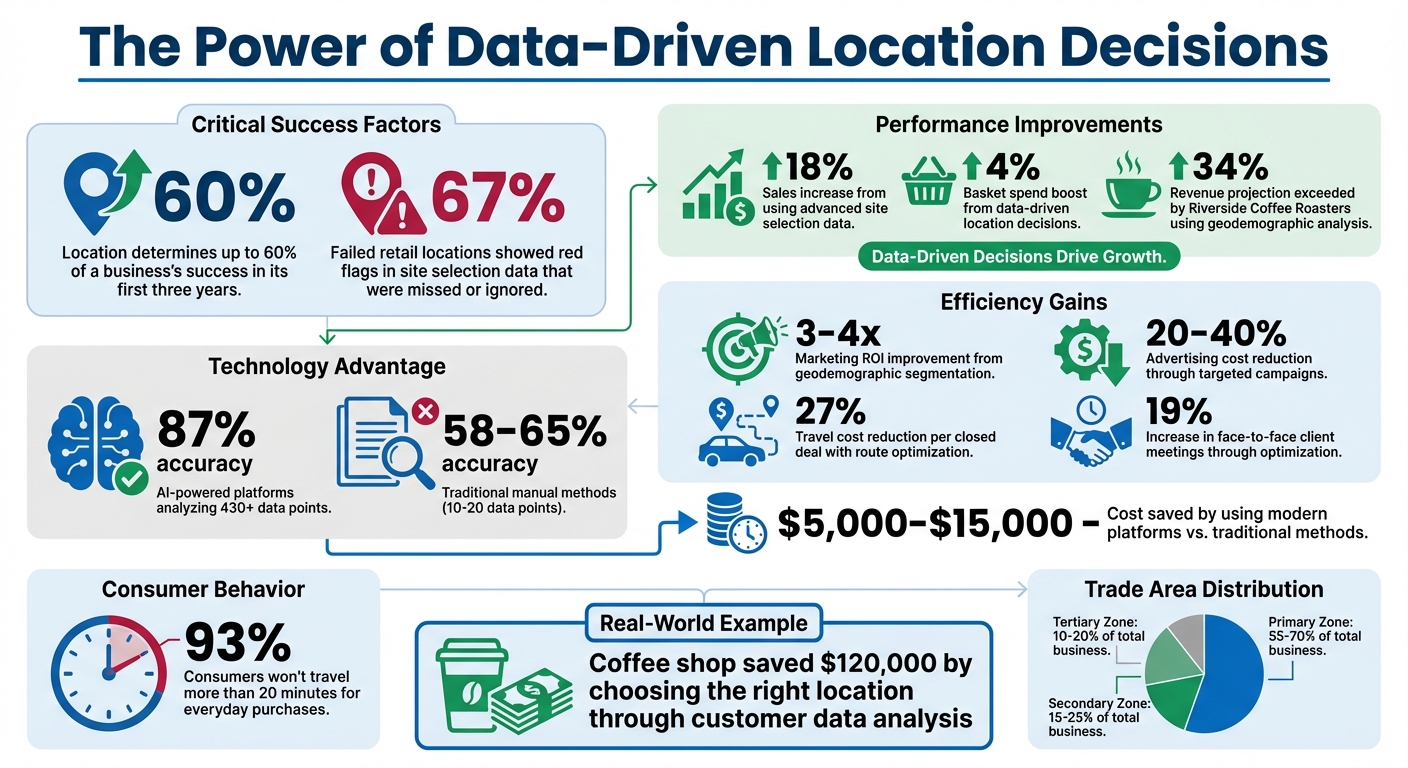
Geographic market analysis helps small and medium-sized businesses (SMBs) make smarter location decisions by using data instead of guesswork. It identifies where your customers are, how far they’ll travel, and what factors influence their behavior. This process is critical because location can determine up to 60% of a business's success in its first three years. Here’s what you’ll gain from this guide:
- Trade Area Analysis: Learn to define Primary, Secondary, and Tertiary trade areas based on customer behavior, not just distance.
- Demographics and Economics: Use population trends, income levels, and local economic data to assess market potential.
- Competitor Mapping: Identify gaps in the market and evaluate saturation using tools like NAICS codes and spatial analysis.
- Drive-Time Mapping: Replace outdated radius methods with travel-time analysis to better reflect customer accessibility.
- Geodemographic Segmentation: Target specific neighborhoods to improve marketing ROI by 3–4x.
- Tools and Data Sources: Access free resources like the Census Business Builder, ACS, and BLS to gather actionable insights.
By combining these techniques with advanced tools like AI-powered platforms, SMBs can reduce costly mistakes and improve profitability. For example, a coffee shop that analyzed customer data saved $120,000 by choosing the right location.
Key takeaway: Data-driven location decisions can increase sales by 18% and avoid the pitfalls that lead to failure for 67% of retail businesses. Use this guide to make informed, precise choices for your next business move.
Geographic Market Analysis Impact: Key Statistics for SMB Success
Core Elements of Geographic Market Analysis
Demographics and Population Data
Understanding the demographics of an area - such as age, gender, race, ethnicity, and household composition - helps gauge the potential market size. Additionally, housing ownership and the types of housing units provide clues about local economic stability and wealth.
Population growth trends are another key metric. For example, between July 1, 2024, and July 1, 2025, the U.S. population grew by 0.5% (an increase of 1.8 million people). To evaluate whether a market is growing or shrinking, look at natural change (births minus deaths) and net migration (inflow versus outflow of people). It's also important to distinguish between international migration and domestic migration, as each reflects different economic factors. For instance, domestic migration often highlights shifts in job markets or quality-of-life preferences.
"From July 2024 through June 2025, the Midwest also saw positive net domestic migration for the first time this decade." - Marc Perry, Senior Demographer, U.S. Census Bureau
Regional population shifts provide valuable insights for small and medium-sized businesses (SMBs). In 2025, South Carolina experienced the highest growth rate at 1.5%, followed by Idaho at 1.4% and North Carolina at 1.3%. On the other hand, Florida saw a sharp drop in net domestic migration, with only 22,517 people moving in during 2025, compared to 310,892 in 2022. These trends reveal where consumer bases are expanding or declining.
To access this data, tools like the Census Business Builder (CBB) and QuickFacts offer free city, county, and state-level information. For deeper insights, the American Community Survey (ACS) provides detailed data on workforce composition and household characteristics.
Economic Indicators
Demographic data is just the start - economic indicators provide the next layer of understanding by revealing consumers' purchasing power. Metrics like industry revenue and sales data help gauge market demand. Employment and payroll statistics, meanwhile, shed light on whether a region has a stable economic foundation and workforce.
In 2023, there were 8,361,342 business establishments in the U.S., with 7,152,312 of them employing 19 or fewer people. This high concentration of small businesses highlights the competitive nature of most markets. Housing ownership is another useful proxy for assessing local economic stability and disposable income levels.
For businesses planning to expand or acquire, the Economic Census is a vital resource. Conducted every five years, it provides comprehensive statistics at national, state, and local levels and serves as the official benchmark for GDP and the Producer Price Index. Tools like the Census Business Builder can help businesses access curated demographic and economic data specifically designed for market research. For more localized insights, programs offering ZIP code-level data can provide a sharper picture than broader county or state summaries. QuickFacts is particularly useful for comparing demographic and business statistics for cities and towns with populations of 5,000 or more.
Industry and Competitor Analysis
Once you've analyzed demographics and economic indicators, the next step is to evaluate your competitors and identify gaps in the market. Start by defining your industry using NAICS codes, which classify businesses into specific sub-sectors. For example, code 7221 represents full-service restaurants. This level of specificity allows you to track industry trends and estimate potential sales by multiplying the population in your trade area by the national per capita spending for your category.
Spatial analysis tools, such as point pattern analysis, can map the locations of competitors and customers, helping to identify clusters or underserved areas. While traditional market research might cover 10–20 data points, modern AI platforms analyze over 430 data points with 87% accuracy, offering a more comprehensive view.
This approach helps pinpoint "hot spots" of demand and assess market saturation by determining how many similar businesses already exist within a given area. The size of your trade area depends on your business type - a convenience store might draw customers from a 10-mile radius, while a furniture store could attract customers from up to 50 miles away. Be sure to map both direct competitors and indirect ones that serve the same customer base with different products. Before finalizing a location, validate your findings by analyzing data from at least 200–500 customers to ensure the patterns are statistically reliable.
How Culture and Socioeconomic Factors Shape Markets
Understanding Local Culture
Culture plays a significant role in shaping consumer behavior, influencing everything from food preferences to how people communicate and interact. These cultural variations impact aesthetics, business practices, and even product offerings. Overlooking these differences is a common reason why marketing campaigns fail in foreign markets. For example, McDonald's successfully entered India by recognizing that around 80% of the population avoids beef. Through careful research, they adapted their menu to include lamb and other alternatives, catering to local dietary norms.
Cultural nuances also extend to language, symbols, and traditions. In Japan, for instance, black and white are often linked to mourning, making them less suitable for product packaging. Similarly, in many Hispanic communities, purple is associated with death. Even business customs vary widely - while silence during meetings is seen as respectful in Japan, strict punctuality in parts of the Middle East or Latin America might come across as overly assertive.
"Culture, a society's 'programming of the mind,' has both a pervasive and changing influence on each national market environment."
– Babu John Mariadoss, Associate Professor
For small and medium-sized businesses (SMBs), understanding these cultural subtleties is crucial. Direct research methods like surveys, focus groups, and interviews can uncover valuable insights that broader data sources might miss.
While culture defines preferences, socioeconomic factors shape what consumers can afford.
Evaluating Socioeconomic Factors
Beyond cultural differences, socioeconomic factors directly impact purchasing power. Factors such as income, education, and household size provide a window into a market's spending capacity. Education, in particular, has a noticeable effect on consumer behavior and spending habits.
A great example of adapting to socioeconomic realities is Mary Kay Cosmetics’ expansion in Asia. By analyzing local wage data, they discovered that Chinese women, motivated by career opportunities as beauty consultants, exceeded expectations in their response to the brand - despite national income averages suggesting otherwise.
Resources like the American Community Survey (ACS) and Census Business Builder can offer further clarity by providing detailed demographic and economic data.
"The answers often lie in the numbers - numbers that reflect what our communities look like, how our communities have changed, and how those changes impact our daily lives."
– U.S. Census Bureau
Consumer values are also evolving. For instance, the shift from car-dependent suburbs to walkable urban areas highlights changing priorities, reflecting a growing preference for convenience and accessibility.
Tools and Data Sources for Market Analysis
Free Public Data Resources
Small business owners in the U.S. have access to a variety of free government resources to aid in geographic market analysis. One standout is the Census Business Builder (CBB), provided by the U.S. Census Bureau. This tool offers demographic and economic data at multiple geographic levels, making it an excellent resource for evaluating whether to open or expand a business in a specific location.
"The American Community Survey (ACS) provides businesses with a wealth of free information that they can use for selecting a new location or for evaluating the target market or workforce characteristics." - U.S. Census Bureau
The American Community Survey (ACS) takes this a step further by delivering highly detailed, localized data. For quick overviews, QuickFacts offers easy-to-access statistics for any state, county, or city with a population over 5,000.
Employment and wage data are also available through the U.S. Bureau of Labor Statistics (BLS), which provides insights into regional trends using tools like the Consumer Price Index (CPI) and Producer Price Index (PPI). BLS data highlights a stable employment landscape, offering valuable context for SMBs evaluating economic conditions.
For industry-specific and competitive analysis, the County Business Patterns (CBP) and the Economic Census are indispensable. The CBP provides details on the number of establishments, payroll figures, and employment sizes by industry at the county level. Meanwhile, the Economic Census - conducted every five years - stands out as the sole source of local business revenue data. Tools like OnTheMap allow businesses to visualize workforce commuting patterns, offering insights into where potential employees live and their travel distances.
To help users navigate these tools, the Census Bureau also offers free training workshops led by Data Dissemination Specialists. Together, these resources form a robust foundation for SMBs conducting market research.
How Kumo Supports Market Research

While public data provides a strong starting point, tools like Kumo take market analysis to the next level. Kumo uses AI to consolidate and analyze business-for-sale listings from thousands of sources, including marketplaces and brokerages, into a single platform. This eliminates the need to comb through multiple websites, saving time and effort for SMB owners.
Kumo’s custom filters allow users to narrow down opportunities based on location, industry, and financial details. Its analytics features provide insights across aggregated listings, helping businesses evaluate potential targets more efficiently. The platform also offers deal alerts, notifying users when new opportunities that match their criteria become available. For those who prefer deeper analysis, filtered results can be exported to CSV files.
How Do You Analyze Market Trends In A Geographic Market? - BusinessGuide360.com
sbb-itb-97ecd51
Advanced Methods for Geographic Market Analysis
Building on the basics, these advanced techniques help businesses uncover deeper insights about market behavior and customer access.
Drive-Time and Custom Polygon Analysis
Many small businesses begin with basic radius mapping - drawing 1, 3, or 5-mile circles around their location. While simple, this method doesn’t reflect real-world conditions. For example, a 2-mile trip might take 30 minutes due to traffic or obstacles, while a 5-mile drive could take just 10 minutes on a clear route.
Drive-time analysis, also known as isochrone mapping, addresses this by mapping service areas based on actual travel time rather than straight-line distance. It factors in road layouts, speed limits, and traffic patterns. This matters because 93% of consumers typically won’t travel more than 20 minutes for everyday purchases. For example, quick-service restaurants often focus on customers within a 10–15 minute drive, while medical clinics might extend their range to 30 minutes.
"A straight-line radius around a location doesn't tell the whole story... if it takes them 30 minutes to drive there due to traffic or road layout, that's a very different customer experience." – Smappen
Custom polygons take this a step further by allowing businesses to define unique boundaries shaped by real-world factors like customer clusters, franchise territories, or delivery zones. When creating these polygons, consider physical barriers like rivers and highways, as well as psychological barriers - such as perceived neighborhood boundaries - that might discourage customer flow. This level of precision can identify underserved areas where competitors are less accessible or prevent overlapping service areas that lead to internal competition.
| Trade Area Tier | % of Total Business | Description |
|---|---|---|
| Primary | 55-70% | Core market with minimal travel friction; typically a 5–15 minute journey |
| Secondary | 15-25% | Customers who find the location convenient but live or work farther away |
| Tertiary | 10-20% | Occasional customers from outer areas or those seeking unique offerings |
Once you’ve mapped accessibility using these tools, the next step is to refine customer profiles with geodemographic segmentation.
Geodemographic Segmentation
Geodemographic segmentation blends location data with demographics - like age, income, and family structure - to create detailed customer profiles. It assumes that people in the same neighborhood often share similar lifestyles and spending habits.
This approach transforms broad marketing efforts into highly targeted campaigns. Instead of spending resources on an entire metro area, businesses can focus on ZIP codes where their ideal customers are concentrated. This strategy often cuts advertising costs by 20–40% and can boost response rates by 3–4 times compared to untargeted campaigns.
Take the example of Riverside Coffee Roasters, a small business with $650,000 in annual revenue. By analyzing 18 months of customer data, they found that 52% of their 4,200 customers came from just four ZIP codes. When they opened a second location within this cluster - despite paying $400 more in monthly rent - the new site reached profitability by month four (versus a projected eight months) and exceeded first-year revenue projections by 34%.
To start, collect ZIP codes at checkout or use loyalty program data to map customer origins. Look for patterns, such as clusters of high-value customers, and prioritize those areas for direct mail campaigns or local events. Small businesses can even access free GIS mapping tools and demographic reports through Small Business Development Center (SBDC) advisors.
But geographic markets are not static; they shift with time and seasons.
Seasonal and Regional Variations
Market behavior changes depending on the time of day, week, or year. For example, a downtown lunch spot may rely on office workers during weekdays but attract residents and tourists on weekends. Similarly, a ski resort town might see its population triple in winter compared to summer. Ignoring these temporal patterns can lead to flawed strategies.
Define separate trade areas for daytime versus evening populations. Daytime trade areas are shaped by employment hubs, while evening and weekend zones reflect residential patterns. For businesses that cater to tourists or seasonal customers, clustering analysis can pinpoint geographic pockets where these visitors originate.
Physical barriers also play a role. Rivers, highways, and mountains can shrink or distort trade areas, even if the actual distance is short. For instance, a location just 3 miles away across a river with limited bridges might attract fewer customers than one 5 miles away with direct highway access.
To stay ahead, update your spatial analysis every 12–18 months. Consumer habits evolve with neighborhood changes, new competitors, or shifting demographics. Outdated data may miss recent trends or population shifts. Tools like Department of Transportation traffic counts can provide insights into vehicle volume near your location - helpful for gauging potential impulse customers or overall regional flow.
"No community has a single trade area. In reality, each individual business has its own trade area." – Ryan Pesch and Bill Ryan, University of Wisconsin-Madison
Measuring and Improving Performance
This section shifts the focus from market analysis to tracking outcomes and fine-tuning territories. By using measurable metrics instead of relying on instincts, you can ensure your strategy evolves with actual results. Without proper tracking, underperformance can go unnoticed, leading to missed opportunities for improvement.
Key Performance Indicators (KPIs)
To effectively manage territories, certain KPIs are critical:
- Revenue per Account: Territories with revenue below $50,000 per account experience churn rates over 23% higher than those exceeding $100,000.
- Gross Margin by Territory: Urban areas tend to achieve margins around 42%, while rural areas often see lower margins, around 29%, due to increased logistics and travel costs.
- Sales Velocity: Use the formula (Opportunities × Deal Size × Win Rate) ÷ Cycle Time to measure how quickly deals close in each region. Slower velocity may indicate poor market fit or ineffective local outreach.
For market penetration, compare your Territory Market Share against local market trends. For example, if your sales grow by 12% but the addressable market grows by 15%, you're losing ground. Another useful metric is the Herfindahl-Hirschman Index (HHI), which measures market concentration. Scores above 2,500 suggest intense competition, often leading to a 40% drop in acquisition rates.
"Effective territory management does not rely on gut feeling or anecdotal evidence. High-performing organizations use concrete metrics to allocate resources, evaluate opportunities, and reduce overspending." – Fred Metterhausen, Product Owner, Maptive
Geographic A/B Testing
Geo-testing, or geographic A/B testing, is a privacy-friendly way to measure marketing impact by applying a treatment to one region while using a similar region as a control. There are three primary types of geo-tests:
- Holdout tests: Stop media spending in specific areas to assess baseline sales without advertising.
- Scale tests: Increase spending in certain regions to determine the ROI of additional investment.
- Split tests: Experiment with different strategies, such as varying ad creatives or pricing models, in separate regions to see which performs better.
When selecting test and control regions, ensure they are comparable in terms of size, demographics, economic conditions, and historical sales. Test durations vary: digital or holdout tests typically last 2–6 weeks, while scale tests may run 4–8 weeks to capture consumer behavior cycles. Success is measured by Incremental Lift (the percentage of conversions directly linked to the test) and Incremental ROI (incremental revenue divided by incremental ad spend).
"Geo testing is a powerful, privacy-compliant methodology for measuring the true, causal impact of your marketing spend." – Clay Cohen, VP of Marketing, Measured
To ensure clean results, avoid launching other promotions or changing tactics during the test period. A post-test cool-down period can also help capture delayed effects. Use the insights from geo-testing to refine territory boundaries and optimize resource allocation.
Territory Optimization
Once high-performing territories are identified, adjust boundaries to improve efficiency. Look for micro-territory hotspots - smaller areas within broader ZIP codes that outperform expectations. Route optimization is another key strategy. By implementing route optimization software, businesses can cut travel costs per closed deal by 27% and increase face-to-face client meetings by 19%.
Be mindful of cannibalization, where a new location may pull customers from an existing one instead of expanding your market. Mapping overlapping trade areas is crucial, as primary trade areas should ideally account for 55–70% of your total business.
Conclusion
Key Takeaways
Geographic market analysis can turn location decisions into a major advantage. By understanding trade area zones, businesses can focus their resources where they’ll have the greatest impact.
Here’s a striking statistic: 67% of failed retail locations showed red flags in site selection data that were either missed or ignored. On the flip side, using advanced site selection data can increase sales by 18% and boost basket spend by 4%. And location decisions? They’re responsible for up to 60% of a new business's success or failure within the first three years.
Modern tools like drive-time mapping and spatial autocorrelation go beyond basic radius analysis. They help pinpoint customer clusters, assess competitor density, and identify barriers - both physical and psychological - that traditional methods often overlook. What’s more, AI-powered platforms now make this level of analysis accessible to small and medium-sized businesses. These platforms can process over 430 data points in minutes with 87% accuracy, compared to the 58–65% accuracy of older, manual methods that used to take weeks and cost $5,000–$15,000.
"Spatial analysis won't make the economy easier. But it can make your decisions sharper. And right now, that edge matters." – Sondra Hoffman
These tools and insights provide a clear path for smarter decision-making.
Next Steps for SMBs
Start by making the most of the customer data you already have. Export customer addresses from your POS or CRM system - just 200–500 records can reveal valuable patterns. Free tools like the U.S. Census Bureau's Business Builder or geocod.io (which allows up to 2,500 free address conversions daily) can help you map where your top customers live.
To define trade areas more effectively, use drive-time analysis instead of simple radius circles. This approach accounts for real-world factors like traffic and natural barriers (think highways or rivers). Segment your analysis by customer value - mapping your highest-spending customers separately often uncovers concentrated opportunities for growth or targeted marketing.
If you’re eyeing acquisitions or expansion, platforms like Kumo (https://withkumo.com) are worth exploring. Kumo integrates business listings with analytics, helping you evaluate potential locations based on demographic and economic data - all without juggling multiple tools.
Choosing the right location can mean the difference between bustling foot traffic and deserted aisles. With consumers often unwilling to travel far, precision is critical. By combining these strategies with available tools, you can let data guide your decisions and sharpen your instincts.
FAQs
Why is drive-time mapping more effective than radius mapping for SMBs?
Drive-time mapping outshines radius mapping by factoring in real-world travel conditions like road networks, traffic patterns, and geographical obstacles. While radius mapping measures distance in a straight line, drive-time mapping gives a more practical picture of how far someone can actually travel within a specific time frame.
This method is particularly helpful for small and medium-sized businesses (SMBs) in cities where traffic and road conditions can vary widely. For instance, a delivery business might use a 15-minute drive-time zone to outline feasible service areas, leading to improved customer satisfaction and more efficient delivery routes. Additionally, drive-time mapping can reveal underserved regions and support better decisions about where to locate new sites, allocate resources, or pursue growth opportunities.
What economic factors should SMBs evaluate when analyzing a geographic market?
When evaluating a geographic market, small and medium-sized businesses (SMBs) should pay attention to key economic indicators that shed light on the area's economic health and business potential. These indicators include metrics like sales, employment rates, and business expenses, which provide a snapshot of the region's economic activity. Tools like the Location Quotient (LQ) can also be incredibly useful, as they measure industry concentration in a specific area compared to national averages, helping businesses spot opportunities or avoid oversaturated markets.
Beyond that, demographic and socioeconomic data - such as population growth, income levels, and workforce characteristics - play a crucial role in understanding consumer behavior and gauging market demand. Broader economic trends like GDP growth, rates of new business formation, and regional employment statistics add further depth to the analysis. By factoring in these elements, SMBs can make smarter decisions about where to launch or expand, ensuring their plans align with the economic realities of the area.
How can geodemographic segmentation help SMBs improve their marketing ROI?
Geodemographic segmentation helps small and medium-sized businesses (SMBs) fine-tune their marketing by focusing on specific customer groups based on where they live and their demographic characteristics. This strategy allows businesses to create personalized messages and offers that align with the unique preferences and needs of each group. The result? Higher engagement and better conversion rates.
By zeroing in on the most relevant audiences, SMBs can avoid wasting money on broad, ineffective advertising. Instead, they can allocate their marketing budgets more effectively and see improved campaign outcomes.
This method also uncovers high-value customer segments that share common behaviors or lifestyles. For example, understanding local tastes or socioeconomic trends helps businesses design marketing strategies that feel more relevant and relatable. This connection can lead to stronger customer relationships and increased loyalty.
In short, geodemographic insights give SMBs the tools to refine their marketing efforts, improve customer satisfaction, and maximize their return on investment - even in competitive markets.