

Codely v2.0 public release is here
Lorem ipsum dolor sit amet, consectetur adipiscing elit lobortis arcu enim urna adipiscing praesent velit viverra sit semper lorem eu cursus vel hendrerit elementum morbi curabitur etiam nibh justo, lorem aliquet donec sed sit mi dignissim at ante massa mattis.
- Neque sodales ut etiam sit amet nisl purus non tellus orci ac auctor
- Adipiscing elit ut aliquam purus sit amet viverra suspendisse potent i
- Mauris commodo quis imperdiet massa tincidunt nunc pulvinar
- Adipiscing elit ut aliquam purus sit amet viverra suspendisse potenti
What has changed in our latest release?
Vitae congue eu consequat ac felis placerat vestibulum lectus mauris ultrices cursus sit amet dictum sit amet justo donec enim diam porttitor lacus luctus accumsan tortor posuere praesent tristique magna sit amet purus gravida quis blandit turpis.
All new features available for all public channel users
At risus viverra adipiscing at in tellus integer feugiat nisl pretium fusce id velit ut tortor sagittis orci a scelerisque purus semper eget at lectus urna duis convallis. porta nibh venenatis cras sed felis eget neque laoreet suspendisse interdum consectetur libero id faucibus nisl donec pretium vulputate sapien nec sagittis aliquam nunc lobortis mattis aliquam faucibus purus in.
- Neque sodales ut etiam sit amet nisl purus non tellus orci ac auctor
- Adipiscing elit ut aliquam purus sit amet viverra suspendisse potenti
- Mauris commodo quis imperdiet massa tincidunt nunc pulvinar
- Adipiscing elit ut aliquam purus sit amet viverra suspendisse potenti
Coding collaboration with over 200 users at once
Nisi quis eleifend quam adipiscing vitae aliquet bibendum enim facilisis gravida neque. Velit euismod in pellentesque massa placerat volutpat lacus laoreet non curabitur gravida odio aenean sed adipiscing diam donec adipiscing tristique risus. amet est placerat in egestas erat imperdiet sed euismod nisi.
“Nisi quis eleifend quam adipiscing vitae aliquet bibendum enim facilisis gravida neque velit euismod in pellentesque massa placerat”
Real-time code save every 0.1 seconds
Eget lorem dolor sed viverra ipsum nunc aliquet bibendum felis donec et odio pellentesque diam volutpat commodo sed egestas aliquam sem fringilla ut morbi tincidunt augue interdum velit euismod eu tincidunt tortor aliquam nulla facilisi aenean sed adipiscing diam donec adipiscing ut lectus arcu bibendum at varius vel pharetra nibh venenatis cras sed felis eget dolor cosnectur drolo.
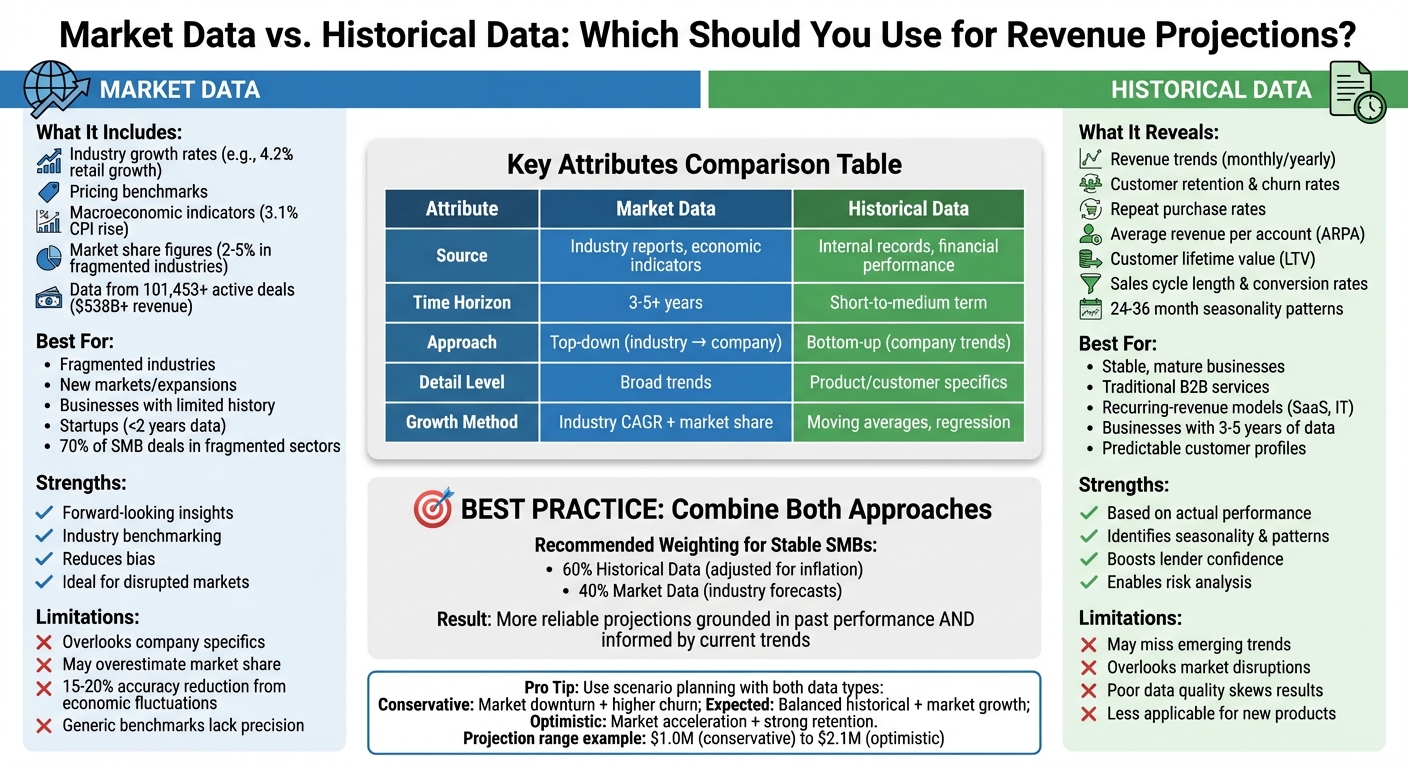
When projecting revenue for small and medium-sized business (SMB) acquisitions, the choice between market data and historical data is critical. Each offers distinct advantages, but relying solely on one can lead to inaccurate forecasts. The solution? Combine both.
- Market Data: Focuses on external trends like industry growth rates, competitor benchmarks, and broader economic indicators. Best for fragmented industries, new markets, or businesses with limited history. However, it may overlook company-specific details.
- Historical Data: Relies on past performance metrics like revenue trends, customer behavior, and seasonality. Ideal for stable, mature businesses with consistent records. Its limitation? It may fail to reflect market changes or disruptions.
Key Takeaways:
- Use market data for forward-looking insights and to benchmark against industry trends.
- Leverage historical data for company-specific performance and customer behavior patterns.
- A balanced approach combining both methods leads to more reliable projections.
Quick Comparison:
| Attribute | Market Data | Historical Data |
|---|---|---|
| Source | Industry reports, economic indicators | Internal records, financial performance |
| Best Fit | New markets, fragmented industries | Stable, mature businesses |
| Limitations | Overlooks internal specifics | May not account for external changes |
Blending these approaches ensures projections are both grounded in past performance and informed by current trends, helping buyers make smarter decisions in SMB acquisitions.
Market Data vs Historical Data for Revenue Projections: Complete Comparison Guide
What Market Data Brings to Revenue Projections
What Market Data Includes
In the context of U.S. small and medium-sized business (SMB) acquisitions, market data provides a wealth of insights. For example, it includes industry growth rates, such as the 4.2% year-over-year retail growth tracked by IBISWorld for 2023–2024. It also offers pricing benchmarks, showing what similar businesses charge for their products or services, often adjusted for regional differences across the U.S.
Macroeconomic indicators are another key component. The Bureau of Labor Statistics, for instance, reported a 3.1% year-over-year rise in the Consumer Price Index (CPI) by mid-2024. This kind of data helps refine revenue projections by accounting for inflation. Other critical metrics include GDP growth estimates, unemployment rates, and consumer spending trends, which can be sourced from the U.S. Census Bureau's Annual Survey of Entrepreneurs. Additionally, market share figures provide a sense of how much of a market similar SMBs typically capture - often ranging between 2–5% in fragmented industries.
Platforms like Kumo further streamline the process by aggregating real-time market data from over 101,453 active deals, representing more than $538 billion in total annual revenue. These platforms consolidate asking prices, EBITDA multiples, and industry classifications from thousands of brokers, making it easier to benchmark acquisition targets against current market conditions.
Altogether, these data points build a foundation for understanding how market data can guide SMB acquisitions.
When Market Data Works Best
Market data proves especially useful in fragmented industries where no single company dominates - sectors like local services, retail, or professional services. In these cases, relying solely on historical data from one business often falls short of capturing the full market potential. External market trends provide a much-needed broader perspective.
It’s also invaluable for SMBs entering new markets, whether they’re expanding geographically or launching a new product line. In such situations, past performance may not be a reliable predictor of future success, but market data can offer insights based on industry-wide patterns. Similarly, businesses with limited historical records - like startups with less than two years of data or those affected by one-off events like COVID-19 - benefit greatly from external benchmarks. Notably, around 70% of U.S. SMB deals in fragmented sectors rely heavily on market data due to gaps in internal records.
Using these insights helps refine revenue projections and supports more informed decision-making in SMB acquisitions.
Pros and Cons of Market Data
| Aspect | Pros | Cons |
|---|---|---|
| Growth Insights | Highlights industry trends (e.g., 5% U.S. SMB sector growth), revealing broader opportunities | May overlook company-specific limitations - what works broadly might not apply to every business |
| Objectivity | Reduces bias through benchmark-driven CPI adjustments | Economic fluctuations, like inflation spikes, can reduce accuracy by 15–20% |
| Applicability | Ideal for new or disrupted markets where historical data is less relevant | Risks overestimating market share without validating assumptions against specific business data |
| Scenario Planning | Enables conservative, base, and optimistic projections for better decision-making | Generic benchmarks may lack precision, especially when accounting for local variations in the U.S. |
One of the biggest challenges with market data is the tendency to overestimate achievable market share. Just because a market is growing at 4.5% doesn’t mean an SMB will capture that growth. To avoid this pitfall, it’s crucial to validate assumptions with company-specific factors. Combining market data with a business’s historical performance often yields the most accurate projections.
How Historical Data Shapes Revenue Projections
What Historical Data Reveals
When paired with market data, historical data provides a clear picture of a business's past performance. It captures actual metrics, such as revenue trends, customer behavior, and sales activity, offering valuable insights for projections. For U.S. small-to-medium business (SMB) acquisitions, this often includes examining monthly or yearly revenue patterns and breaking them down by product or service line. For instance, a local IT services firm with steady, modest growth can use this data to inform future revenue expectations.
Customer metrics are equally crucial. Retention and churn rates, for example, highlight how stable a company's revenue base is. Subscription businesses with high retention rates tend to have more predictable income streams than those struggling to retain customers. Other useful metrics include repeat purchase rates, contract renewal percentages, average revenue per account (ARPA), and customer lifetime value (LTV). Together, these figures reveal how consistently customers contribute to revenue over time.
Sales funnel data also plays a key role. Metrics like lead volume, conversion rates, average deal size, and sales cycle length help translate current sales efforts into future revenue. For example, steady conversion rates and consistent deal sizes provide a reliable basis for forecasting. Similarly, analyzing historical changes in pricing or discounts can shed light on how past adjustments affected sales volumes and revenue distribution.
Seasonality trends, observed over a 24–36 month period, add another layer of precision. These insights, often drawn from financial records, CRM systems, invoicing tools, and subscription billing platforms, help businesses account for predictable fluctuations in demand.
When Historical Data Is Most Dependable
Historical data proves most reliable in industries that are stable and mature, where market conditions change gradually. Examples include traditional B2B services, local professional services, or non-tech manufacturing and distribution. Businesses with steady performance, consistent product offerings, and predictable customer profiles provide a solid foundation for accurate forecasts.
Recurring-revenue models, such as those used by SaaS companies, managed IT providers, and commercial maintenance firms, offer particularly strong visibility. These businesses often have detailed records of renewals and churn, making their revenue streams easier to predict. Similarly, SMBs operating in stable geographic or demographic markets - like local service providers with long-standing customer bases - tend to exhibit consistent performance patterns. In these cases, assuming that "the past resembles the near future" is more justifiable, making historical trends a dependable tool for revenue projections.
The following table outlines the strengths and weaknesses of using historical data for revenue forecasting.
Pros and Cons of Historical Data
| Aspect | Pros | Cons |
|---|---|---|
| Foundation | Based on actual performance, reducing speculative risks. | May overlook emerging trends or new competitors. |
| Pattern Recognition | Identifies trends, seasonality, and customer behaviors. | Averages can hide volatility or customer concentration risks. |
| Proven Drivers | Highlights successful products, channels, or campaigns. | May miss key shifts like product updates or regulatory changes. |
| Lender Confidence | Well-documented performance boosts investor trust. | Poor data quality (e.g., inconsistent bookkeeping) can skew results. |
| Risk Analysis | Enables scenario planning based on past downturns or surges. | Less applicable for new products, fast-changing markets, or startups. |
One significant risk of relying solely on historical data is assuming that future performance will mirror past trends without accounting for external changes. For example, a restaurant's pre-2019 revenue patterns became irrelevant during the COVID-19 lockdowns. To mitigate this, buyers often supplement historical analysis with market data, competitor insights, and forward-looking indicators like pipeline growth. Combining these elements typically leads to more reliable revenue projections.
Market Data vs. Historical Data: Direct Comparison
How Each Approach Affects Growth Assumptions
Market data takes a top-down view. You start with broad metrics like industry compound annual growth rates (CAGRs), segment-specific trends, and macroeconomic forecasts, then adjust based on expected changes in market share. For instance, if the HVAC services industry shows a 4% annual growth rate, you might project a 5–6% growth for a company aiming to outperform the market.
Historical data, on the other hand, uses a bottom-up perspective. This approach extends a company’s revenue trends and seasonality using tools like moving averages or regression analysis. For example, if an HVAC company has grown 9–11% annually over the past five years while maintaining steady margins, you might set a base-case projection at 8–10%, recognizing that long-term growth often aligns with broader market trends.
In practice, many U.S. SMB acquirers combine both methods. They start with the target company’s historical performance and then cross-check it against industry benchmarks to avoid relying too heavily on one approach. For example, if the industry CAGR is 4% but the target company has consistently grown at 10%, you might project growth at 7–8%, balancing historical outperformance with the likelihood of eventual alignment with market trends.
Here’s a quick comparison of the two approaches:
Key Differences in a Comparison Table
| Attribute | Market Data | Historical Data |
|---|---|---|
| Primary Source | Industry reports, government statistics, competitor filings | Internal financials, CRM records, operational data |
| Level of Detail | Broad industry and segment trends | Detailed insights into product, customer, and channel data |
| Time Horizon | Best for 3–5+ year structural trends | Ideal for short-to-medium-term forecasts |
| Best-Fit Business Types | New SMBs, roll-ups, or sectors with limited history | Mature, stable U.S. SMBs with consistent GAAP financials |
| Growth Assumptions | Forward-looking industry trajectories | Patterns based on past performance and seasonality |
| Main Risks | May overlook company-specific constraints | May fail to account for sudden market shifts (e.g., new technology or regulations) |
How to Choose Between Them
Deciding which approach to use depends on three main factors: the quality of available data, the stability of the market, and the goals of your acquisition strategy.
Start with data quality. If you have three to five years of accurate, segmented financial and CRM data, historical projections are likely your best bet. But if the data is incomplete, inconsistent, or recently adjusted, market benchmarks might be a safer choice.
Consider market stability. In industries with steady growth and minimal disruption - like local professional services or traditional B2B sectors - historical data tends to provide reliable forecasts. However, for fast-evolving or emerging markets, current market and competitive data often carry more weight.
Let your acquisition thesis guide you. If you’re buying a stable, cash-generating business to hold long-term, historical performance should be your primary focus. On the other hand, if your strategy involves consolidating a fragmented market or capturing additional market share in a high-growth industry, market data will likely play a larger role.
sbb-itb-97ecd51
[Modeling 101] 3.1. Two Approaches to Forecasting Revenue
Combining Market and Historical Data for Better Projections
Merging the strengths of market trends and historical performance data creates a more balanced and reliable approach to revenue forecasting.
Creating a Combined Forecast Model
Start by normalizing your historical revenue data and layering in market-driven insights. To normalize, adjust historical figures for inflation using the Consumer Price Index (CPI) from the Bureau of Labor Statistics. For example, if your business implemented a 20% price hike in 2023, adjust earlier figures to isolate genuine growth trends.
Once normalized, apply methods like regression analysis or time series decomposition to identify underlying trends and seasonal patterns. Next, incorporate market factors such as industry growth rates, economic conditions, and competitive benchmarks. For a steady small or medium-sized business (SMB), you might assign 60% of the projection weight to adjusted historical growth and 40% to market forecasts. This balanced approach ensures you respect past performance while considering external factors that could influence future growth. This integrated model lays the groundwork for testing different scenarios.
Testing Scenarios
Relying on a single forecast can lead to surprises, so it’s essential to develop multiple scenarios - conservative, expected, and optimistic. For instance, you could model outcomes where market growth accelerates by 15% or contracts by 10%, while also varying historical factors like customer churn by ±5%. A sensitivity table might show revenue projections ranging from $1.0M during a market downturn to $2.1M in a booming market.
These scenarios highlight how different variables - such as market conditions or retention rates - impact revenue projections. They also provide actionable insights, helping acquirers identify which factors drive the most variance. This clarity is invaluable during negotiations, offering concrete numbers to discuss valuation ranges.
Using This Approach in SMB Deal Sourcing
Once scenarios are tested, use the insights to identify promising SMB opportunities. Platforms like Kumo simplify this process by aggregating data from over 101,000 active business listings, combining historical and real-time market metrics. You can refine your searches with custom criteria - like targeting SMBs with over 10% year-over-year growth in industries showing strong market expansion.
Kumo’s AI-powered analytics summarize listings, making it easier to extract the financial data you need for projections. With access to over 815,000 listings representing more than $538 billion in annual revenue, buyers can benchmark a target’s historical performance against similar deals within the same industry. This combination of detailed historical data and broad market insights helps acquirers build confident projections and spot opportunities where a company’s past success suggests room for further market share growth. By tying these analytical tools to deal sourcing, you can move from theory to actionable results.
Conclusion
Market data and historical data each offer unique advantages when it comes to revenue projections for SMB acquisitions. Market data provides insight into forward-looking trends and industry benchmarks, making it particularly useful for sectors that evolve rapidly or for businesses with limited operational history. On the other hand, historical data highlights established patterns and seasonal trends, making it a better fit for stable businesses with consistent performance. That said, both approaches have their limitations: market data often overlooks company-specific details, while historical data may fail to account for external changes or inflation adjustments. Together, these perspectives create a more balanced and reliable foundation for revenue forecasting.
Blending historical data with market insights reinforces the main idea of this article: effective forecasting requires combining past performance with current trends. This hybrid approach allows for more rigorous scenario planning and boosts confidence in valuations. By adjusting historical data to reflect business changes, factoring in market growth rates, and conducting sensitivity analyses, you can create projections that are not only defensible but also actionable. This method helps identify risks early, refine cash flow forecasts, and ultimately improve SMB acquisition outcomes.
Additionally, tools like Kumo make deal sourcing more efficient by aggregating over 101,000 listings while providing access to both real-time market data and detailed historical trends. This combination empowers acquirers to benchmark targets, uncover growth opportunities, and transition from analysis to execution with greater confidence.
In short, integrating both types of data ensures your projections are grounded in reality while staying adaptable to market changes. This balanced approach provides the clarity and assurance needed to thrive in today’s competitive SMB acquisition environment.
FAQs
When should I use market data instead of historical data for revenue projections?
Market data becomes especially helpful when historical performance is scarce - like in the case of new businesses, emerging industries, or times of sudden market shifts. It provides insights into current trends, customer preferences, and competitive activity, giving you a clearer picture of the present landscape.
Meanwhile, historical data shines for established businesses with steady performance. It helps uncover long-term patterns and supports projections grounded in past results. The key is to evaluate the specific situation of your acquisition and decide whether market data, historical data, or a mix of both will serve your goals better.
What are the potential downsides of using only historical data for revenue projections?
Relying solely on historical data for revenue projections can leave you with an incomplete picture. While past performance is valuable, it often fails to capture current market dynamics, changes in customer behavior, or emerging industry shifts. This gap can lead to missed opportunities or strategies that don’t align with today’s realities.
To create more accurate forecasts, blend historical data with fresh market insights. This approach ensures your analysis accounts for both past trends and the present landscape.
How does combining market data with historical data improve revenue projections?
Blending market data with historical data offers a more precise and comprehensive way to forecast revenue. Historical data sheds light on a business's past performance and trends, while market data reveals current industry conditions and external factors that could influence growth.
When these two data sources are combined, they help uncover new opportunities, confirm previous patterns, and refine forecasts to reflect market changes. This method minimizes uncertainty and enhances the accuracy of revenue predictions - especially valuable when evaluating small and medium-sized business acquisitions.