

Codely v2.0 public release is here
Lorem ipsum dolor sit amet, consectetur adipiscing elit lobortis arcu enim urna adipiscing praesent velit viverra sit semper lorem eu cursus vel hendrerit elementum morbi curabitur etiam nibh justo, lorem aliquet donec sed sit mi dignissim at ante massa mattis.
- Neque sodales ut etiam sit amet nisl purus non tellus orci ac auctor
- Adipiscing elit ut aliquam purus sit amet viverra suspendisse potent i
- Mauris commodo quis imperdiet massa tincidunt nunc pulvinar
- Adipiscing elit ut aliquam purus sit amet viverra suspendisse potenti
What has changed in our latest release?
Vitae congue eu consequat ac felis placerat vestibulum lectus mauris ultrices cursus sit amet dictum sit amet justo donec enim diam porttitor lacus luctus accumsan tortor posuere praesent tristique magna sit amet purus gravida quis blandit turpis.
All new features available for all public channel users
At risus viverra adipiscing at in tellus integer feugiat nisl pretium fusce id velit ut tortor sagittis orci a scelerisque purus semper eget at lectus urna duis convallis. porta nibh venenatis cras sed felis eget neque laoreet suspendisse interdum consectetur libero id faucibus nisl donec pretium vulputate sapien nec sagittis aliquam nunc lobortis mattis aliquam faucibus purus in.
- Neque sodales ut etiam sit amet nisl purus non tellus orci ac auctor
- Adipiscing elit ut aliquam purus sit amet viverra suspendisse potenti
- Mauris commodo quis imperdiet massa tincidunt nunc pulvinar
- Adipiscing elit ut aliquam purus sit amet viverra suspendisse potenti
Coding collaboration with over 200 users at once
Nisi quis eleifend quam adipiscing vitae aliquet bibendum enim facilisis gravida neque. Velit euismod in pellentesque massa placerat volutpat lacus laoreet non curabitur gravida odio aenean sed adipiscing diam donec adipiscing tristique risus. amet est placerat in egestas erat imperdiet sed euismod nisi.
“Nisi quis eleifend quam adipiscing vitae aliquet bibendum enim facilisis gravida neque velit euismod in pellentesque massa placerat”
Real-time code save every 0.1 seconds
Eget lorem dolor sed viverra ipsum nunc aliquet bibendum felis donec et odio pellentesque diam volutpat commodo sed egestas aliquam sem fringilla ut morbi tincidunt augue interdum velit euismod eu tincidunt tortor aliquam nulla facilisi aenean sed adipiscing diam donec adipiscing ut lectus arcu bibendum at varius vel pharetra nibh venenatis cras sed felis eget dolor cosnectur drolo.
If I can’t verify monthly revenue, I don’t trust the growth story. In an SMB deal, I want to know four things fast: is revenue real, is it steady, will it repeat, and what happens if sales fall 10% to 20% after closing?
Here’s the short version:
- I review monthly revenue over multiple years, not just annual totals.
- I tie sales back to tax returns, bank deposits, processor reports, and A/R aging.
- I separate historical actuals from seller forecasts.
- I check whether growth is broad across customers, products, channels, or locations.
- I remove one-time items like insurance payouts, grants, and asset sales.
- I test for seasonality, customer concentration, refunds, chargebacks, and timing issues.
- I compare revenue trends to gross margin, OpEx, EBITDA, and cash flow.
- I run base, downside, and stress cases to find the revenue level where the business stops covering costs and debt.
A few numbers matter right away. If one customer is more than 15% of revenue, I treat that as a clear risk. If reported sales don’t line up with deposits or tax filings, I stop and get support before using the numbers. And if revenue is up but EBITDA is down, I assume growth may be adding strain instead of cash.
This process helps me decide whether the deal supports the asking price, needs a lower valuation, or calls for terms like an earnout, seller note, escrow, or a working-capital adjustment.
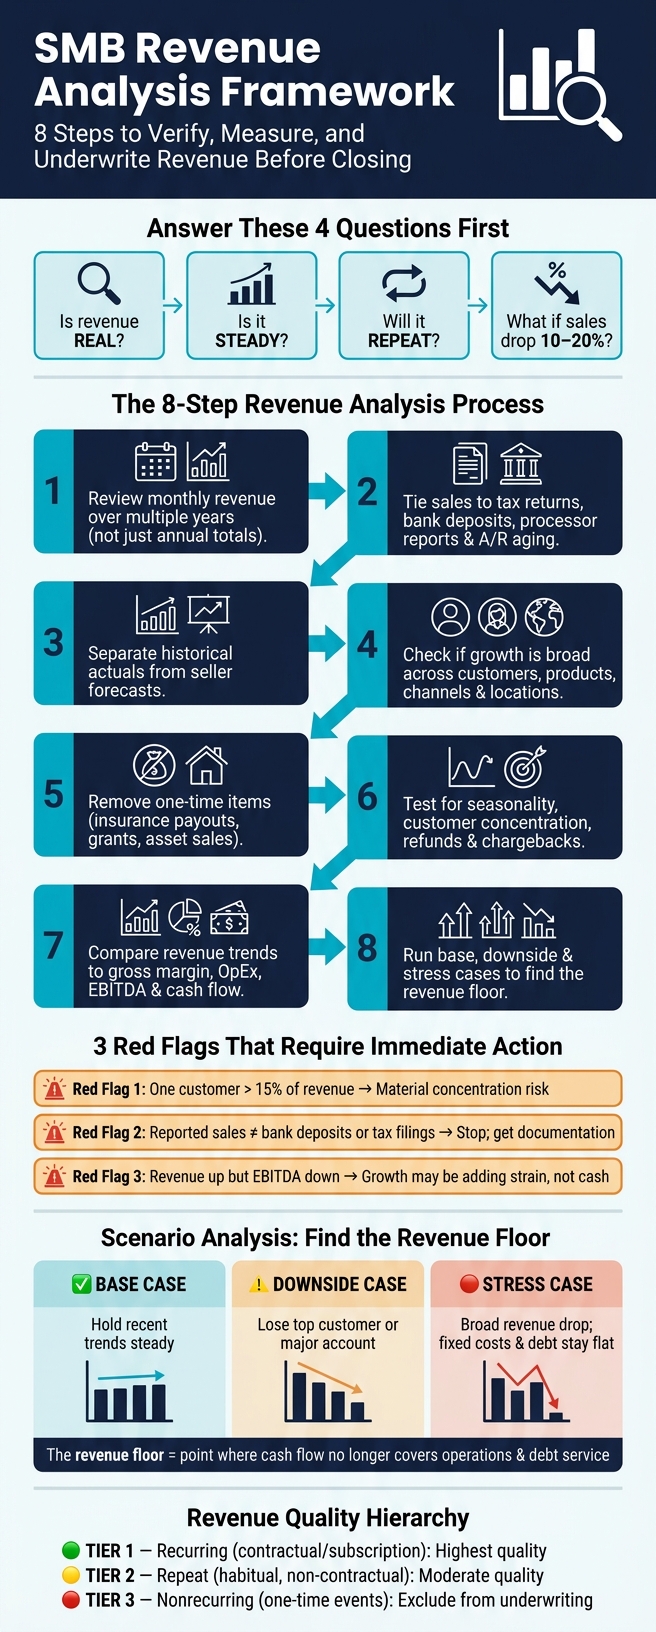
SMB Revenue Analysis Framework: 8-Step Due Diligence Process
5 Ways to Analyze Your Revenue As a Small Business
sbb-itb-97ecd51
Build and Reconcile the Revenue Dataset
Use source records to turn verified history into a month-by-month revenue file. Before you measure growth or look for patterns, you need a dataset you can trust. That means pulling the right records and checking them against each other - not just taking the seller's summary at face value.
Collect Monthly Financial and Operating Records
Ask for monthly profit and loss statements, federal tax returns (Form 1120 or 1065), 12–24 months of bank statements, merchant processor statements or 1099-K forms, accounts receivable aging, customer contracts, and revenue broken out by customer, product, channel, or location.
Monthly records matter because they let you tie each revenue trend back to a source document. If sales jump in March or dip in August, you should be able to see exactly why.
Strip out nonrecurring items such as insurance payouts and asset sales from the revenue analysis.
Use operating reports to build the revenue view. Then verify that view with tax returns, bank statements, and processor records.
Reconcile Reported Revenue to Independent Records
Once the file is built, compare it with independent records line by line. Match revenue reported on the P&L against bank deposits, merchant processor statements, tax returns, and bank statements. Differences are normal, but every gap needs a documented explanation before you rely on the numbers.
A few issues show up again and again:
- Cash vs. accrual timing differences
- Refunds
- Chargebacks
- Deposit timing
If the business uses accrual accounting, revenue may be recorded before cash arrives. Use the table below to track what needs to be normalized and where to verify each adjustment:
| Check | Items to Normalize | Verification Source |
|---|---|---|
| Accounting Basis | Cash vs. accrual timing differences | General ledger, accounts receivable reports |
| One-Off Items | Insurance payouts, asset sales, non-recurring grants | Tax returns, bank statements, income statements |
| Customer Concentration | Revenue from a single customer exceeding 15% | Customer contracts, sales-by-customer reports |
| Cash Accuracy | Refunds, chargebacks, deposit timing | Bank statements, merchant processor reports |
Any gap you can't explain with documentation is a red flag. Get a direct answer from the seller before you move forward.
Use Kumo to Organize Deal Screening Before Diligence
Use Kumo to screen listings from multiple sources and sort the deals that are worth full diligence.
Measure Growth Across Comparable Periods
With a reconciled monthly dataset, compare matching periods to see if growth is actual growth or just a timing issue. Once the revenue data is cleaned up, you can judge how the business has grown - and whether that pace can last.
Calculate Year-Over-Year, Monthly, and Trailing-12-Month Growth
Year-over-year (YoY) growth compares the same month or quarter across different years. That helps cancel out seasonality and shows whether the business is actually getting bigger. Month-over-month (MoM) growth shows near-term movement, but it can get noisy fast. One big order in a single month can throw off the picture. Trailing-12-month (TTM) revenue smooths those swings and gives you a better sense of run rate when the fiscal year isn’t finished.
Read these metrics together. That’s how you separate a real trend from random bumps. If they point in different directions, the business may be slowing down even if the headline run rate still looks strong.
Use CAGR Without Ignoring Volatility
After looking at shorter periods, you can compress the full history into one rate for a longer view. Compound annual growth rate, or CAGR, sums up multi-year performance in a single number. The formula is:
CAGR = [(Ending Value ÷ Beginning Value)^(1/n)] − 1
Where n is the number of years in the period. Use CAGR as a summary, not as a replacement for the monthly trend line. Always plot revenue month by month next to the CAGR figure. That’s where turning points and choppy stretches show up.
Separate Broad-Based Growth from a Narrow Driver
Next, break growth into its drivers so you can see whether it came from the whole business or just one pocket of it. Split revenue by product, channel, or location to check whether growth is spread across the business or tied to one segment. Growth that comes from many parts of the company is often easier to keep going. If most of the gain comes from one product or one channel, you’ll want extra diligence before locking in valuation.
| Pattern | Possible Explanation | Evidence to Request | Deal Impact |
|---|---|---|---|
| Accelerating growth | Market expansion or new product success | Sales by channel; customer acquisition cost trends | Higher valuation multiple; potential for rapid ROI |
| Flattening growth | Market saturation or loss of key sales personnel | Customer churn rates; market share data | Focus on margin improvement rather than revenue growth |
| Declining growth | Competitive pressure or product obsolescence | Reorder cycles; customer reactivation rates | High risk; consider earnouts or seller notes to protect the downside |
Adjust for Seasonality and Test Revenue Quality
Once you’ve measured growth, the next step is to see if it shows up again, turns into cash, and holds up through normal seasonality. Strong YoY or TTM growth can look great on paper and still tell the wrong story if it came from a seasonal bump or a one-off event.
Identify Seasonal Patterns and Unusual Spikes
Start by comparing monthly revenue across multiple years. You’re looking for the same months to rise or fall on a repeat basis. If that pattern shows up year after year, you’re likely looking at seasonality rather than random movement.
Then break the numbers out by product, channel, or location. That helps you tell the difference between a broad business pattern and a spike tied to one corner of the company.
If a spike doesn’t happen again under similar conditions, treat it as a one-time event until the data says otherwise.
Connect Seasonality to Working-Capital Needs
Seasonal revenue doesn’t just affect top-line trends. It also shapes cash flow and valuation. A business that makes most of its money in a short stretch of the year may still need extra cash to cover payroll, inventory, and other costs during slow months.
That’s the key issue: not just whether revenue exists, but whether it comes in soon enough to keep the business running. A company can post strong sales and still feel squeezed if cash lands too late.
Review bank statements and accounts receivable aging during peak periods to confirm that revenue is converting into cash when the business needs it.
Classify Revenue by Recurrence and Concentration
Next, sort revenue by predictability. Contractual recurring revenue tends to be the steadiest. Repeat revenue without a contract can also hold up well if reorder behavior stays steady over time.
| Revenue Type | Definition | Quality Signal |
|---|---|---|
| Recurring | Contractual or subscription-based revenue that is highly predictable | Low churn; high customer lifetime value |
| Repeat | Non-contractual but habitual; driven by reorder cycles or customer reactivation | Consistent reorder frequency; stable repeat volume |
| Nonrecurring | One-time projects, asset sales, insurance payouts | Must be excluded from sustainable EBITDA |
After that, check customer concentration. If one customer makes up more than 15% of total revenue, that’s a material risk. Run a day-one loss scenario for that account and price deal protections around that downside.
Use the recurring and repeat revenue that remains as the sustainable base for underwriting. That’s the base to use in underwriting and scenario analysis.
Connect Revenue Trends to Underwriting and Deal Decisions
Link Revenue Trends to Earnings and Cash Flow
After you isolate repeatable revenue, the next step is simple: see whether that revenue turns into EBITDA and cash.
A company can post rising sales and still end up with weaker economics. More revenue can bring more moving parts, more overhead, and more pressure on margins. That’s why you need to line up revenue trends against gross margin, operating expenses, and EBITDA. The goal is to see whether growth is producing more cash or just more strain.
In search fund acquisitions, revenue drove EBITDA growth, but margin compression offset most of the gain. That’s the issue to test. Does the revenue trend you’ve confirmed flow through to steady EBITDA, or does cost growth swallow it? Before you use any figure in underwriting, remove one-time items so the earnings picture reflects the business as it actually runs.
Run Base, Downside, and Stress Cases
If margins are slipping, push the model harder. You need to know how much revenue the business can lose before cash flow starts to fail.
Build three scenarios:
- Base case: hold recent trends steady.
- Downside case: lose the top customer or another major account.
- Stress case: model a broader revenue drop while fixed costs and debt stay flat.
Center the downside work on customer loss, seasonal weakness, and a broader drop in sales. Then find the revenue floor: the point where cash flow no longer covers operations and debt service.
That number matters more than most headline growth figures. If the floor sits too close to current revenue, the deal has less room for error than it may seem at first glance. In that case, the structure should reflect the risk.
Summarize Findings and Required Deal Protections
Use the scenario output to turn risk into deal terms. Before you lock in the offer, lay out the findings in a matrix so each issue points to a clear action. No hand-waving. Each observation should connect to pricing, structure, or buyer protection.
| Observation | Supporting Evidence | Risk Level | Required Follow-Up | Deal Implication |
|---|---|---|---|---|
| High customer concentration | One customer >15% of total revenue | High | Review customer contracts; conduct anonymized customer calls | Lower purchase price; customer-retention earnout |
| Margin contraction | EBITDA declining despite revenue growth | Medium | Analyze COGS and OpEx trends | Adjust valuation multiple downward |
| Accounting discrepancies | Bank deposits don't match income statements | High | Full bank reconciliation; Quality of Earnings report | Increase escrow holdback; adjust working-capital peg |
| Non-recurring spikes | One-time insurance payouts or asset sales in P&L | Low | Strip from EBITDA normalization | Reduce offer based on sustainable EBITDA |
| Heavy seasonality | Significant monthly revenue swings | Medium | Model 12-month rolling working-capital needs | Seasonal working-capital adjustment in the LOI |
Translate each risk into a pricing, structure, or protection decision.
FAQs
How many years of monthly revenue should I review?
Review at least 2 to 3 years of monthly revenue data. That time frame gives you a clearer view of the business and makes seasonal patterns easier to spot.
For broader due diligence, 3 to 5 years of annual financial statements is standard. But if your goal is to separate true seasonality from one-off swings, a 24- to 36-month monthly view tends to be the most useful.
What if the seller’s revenue doesn’t match tax returns or bank deposits?
Treat it as a red flag and dig in right away. Put the profit-and-loss statement, tax returns, and bank statements side by side to find gaps in timing, dollar amounts, or how items were labeled.
Start by ruling out timing issues and non-revenue cash inflows. If the numbers still don’t line up, look at revenue recognition problems or possible manipulation. For any big gap that still can’t be explained, deal with it through valuation adjustments, earn-outs, or tighter contract protections.
How do I tell if revenue growth is sustainable?
Look past top-line revenue and focus on earnings quality. Break revenue into segments by product, channel, or location so you can see what’s actually driving growth. And put more weight on recurring revenue, like subscriptions or long-term contracts, because that income tends to be more stable.
Next, normalize the results by stripping out non-recurring items. Confirm revenue with a proof-of-cash review, then run downside scenarios to test whether the business can still meet its obligations when things get tight.