

Codely v2.0 public release is here
Lorem ipsum dolor sit amet, consectetur adipiscing elit lobortis arcu enim urna adipiscing praesent velit viverra sit semper lorem eu cursus vel hendrerit elementum morbi curabitur etiam nibh justo, lorem aliquet donec sed sit mi dignissim at ante massa mattis.
- Neque sodales ut etiam sit amet nisl purus non tellus orci ac auctor
- Adipiscing elit ut aliquam purus sit amet viverra suspendisse potent i
- Mauris commodo quis imperdiet massa tincidunt nunc pulvinar
- Adipiscing elit ut aliquam purus sit amet viverra suspendisse potenti
What has changed in our latest release?
Vitae congue eu consequat ac felis placerat vestibulum lectus mauris ultrices cursus sit amet dictum sit amet justo donec enim diam porttitor lacus luctus accumsan tortor posuere praesent tristique magna sit amet purus gravida quis blandit turpis.
All new features available for all public channel users
At risus viverra adipiscing at in tellus integer feugiat nisl pretium fusce id velit ut tortor sagittis orci a scelerisque purus semper eget at lectus urna duis convallis. porta nibh venenatis cras sed felis eget neque laoreet suspendisse interdum consectetur libero id faucibus nisl donec pretium vulputate sapien nec sagittis aliquam nunc lobortis mattis aliquam faucibus purus in.
- Neque sodales ut etiam sit amet nisl purus non tellus orci ac auctor
- Adipiscing elit ut aliquam purus sit amet viverra suspendisse potenti
- Mauris commodo quis imperdiet massa tincidunt nunc pulvinar
- Adipiscing elit ut aliquam purus sit amet viverra suspendisse potenti
Coding collaboration with over 200 users at once
Nisi quis eleifend quam adipiscing vitae aliquet bibendum enim facilisis gravida neque. Velit euismod in pellentesque massa placerat volutpat lacus laoreet non curabitur gravida odio aenean sed adipiscing diam donec adipiscing tristique risus. amet est placerat in egestas erat imperdiet sed euismod nisi.
“Nisi quis eleifend quam adipiscing vitae aliquet bibendum enim facilisis gravida neque velit euismod in pellentesque massa placerat”
Real-time code save every 0.1 seconds
Eget lorem dolor sed viverra ipsum nunc aliquet bibendum felis donec et odio pellentesque diam volutpat commodo sed egestas aliquam sem fringilla ut morbi tincidunt augue interdum velit euismod eu tincidunt tortor aliquam nulla facilisi aenean sed adipiscing diam donec adipiscing ut lectus arcu bibendum at varius vel pharetra nibh venenatis cras sed felis eget dolor cosnectur drolo.
I use revenue multiples to screen SMB deals - not decide what to pay. I start with businesses in the same industry and revenue range, then calculate enterprise value ÷ annual revenue using matching financial periods and accounting methods.
A low multiple isn’t enough. Here’s what I check before comparing deals:
- Price basis: What does the price include? I reconcile debt, cash, assets, and working capital, and label asking-price ratios as indicative.
- Business model: For owner-operated businesses, I check replacement labor costs. For manager-led businesses, I verify management costs and seller duties. For owner-dependent recurring-revenue businesses, I check renewals and contract transfer terms.
- Financial quality: I review at least 3 years of results plus the trailing 12 months, checking growth, margins, cash flow, customer concentration, leases, and licenses.
- Comparison quality: I use documented benchmarks and a 0–100 comparability score to prioritize diligence - not estimate value. Three hypothetical profiles aren’t a market benchmark.
My rule: <u>verify the inputs before trusting the multiple</u>. If enterprise value or revenue is unresolved, I leave the ratio unavailable.
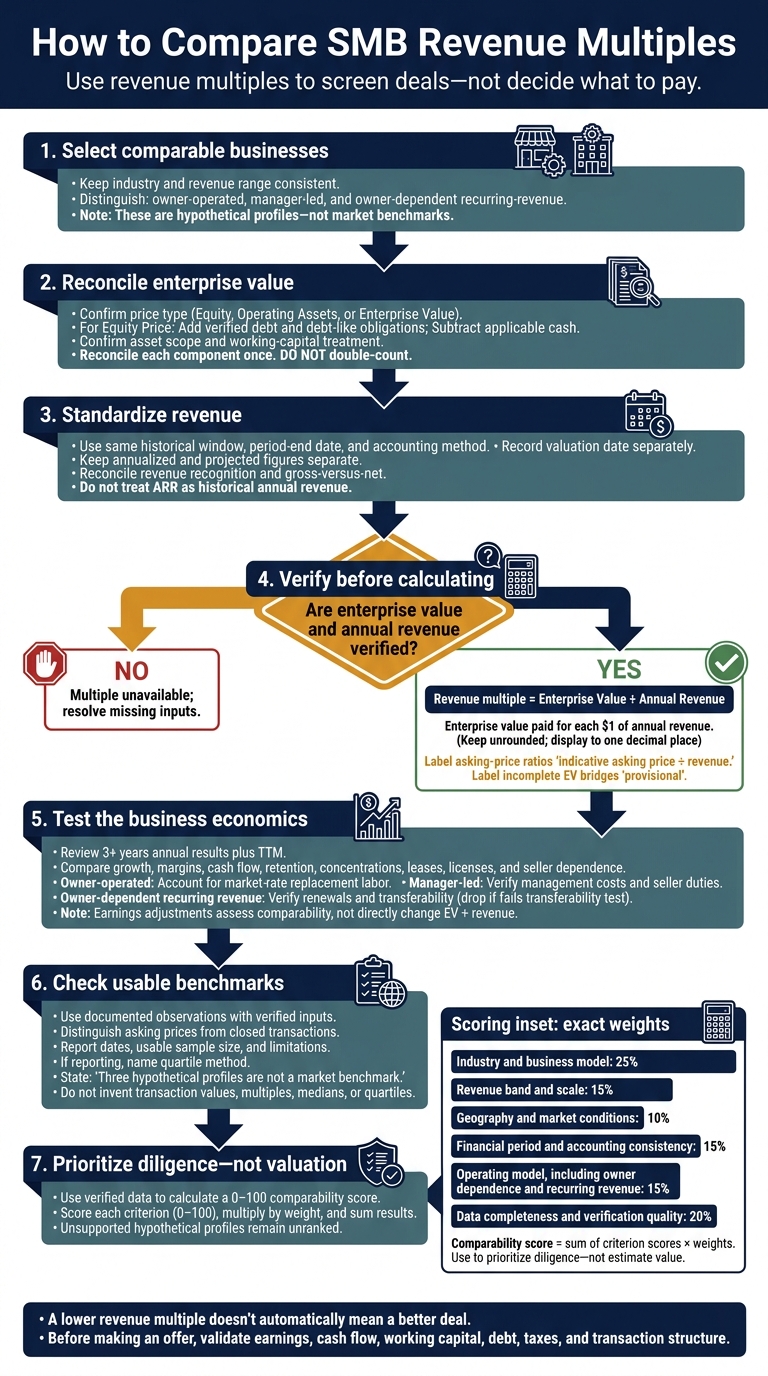
How to Compare SMB Revenue Multiples
Session 18: Revenue Multiples
sbb-itb-97ecd51
Owner-Operated Business (Hypothetical)
Use this profile to test owner dependence, not to estimate a price. Focus on what the owner does and how much it would cost to replace that work.
Industry and Revenue Band
In Kumo, add keywords related to owner involvement. Keep only listings that include revenue and earnings data.
Enterprise Value Basis
Record working capital needs at closing. Funding payroll and inventory changes how much cash you need to buy the business - costs that a revenue multiple alone won’t show.
Financial Period Consistency
Note whether revenue covers the trailing twelve months (TTM), the last fiscal year, or a forecast. Compare only listings with the same period-end date and supporting statements.
Operating Economics
List the owner’s duties and customer relationships. If earnings are reported as SDE, subtract market-rate pay for someone to replace the owner before comparing the deal with a manager-led business. SDE includes owner pay and perks; manager-led EBITDA already deducts management pay.
Use those adjusted earnings as the baseline for the manager-led comparison that follows.
Manager-Led Business (Hypothetical)
Compare this scenario with the owner-operated baseline to assess revenue multiples when paid managers handle daily operations after the seller exits.
Industry and Revenue Band
In Kumo, keep the industry and revenue-band filters fixed. Treat keywords like “manager-led” or “full management team” as screening signals - not proof that the business can run without the owner.
Enterprise Value Basis
Put deal values on the same basis before comparing multiples. If the asking price reflects equity value, add debt the buyer assumes or repays, then subtract cash acquired. Note whether the price includes working capital, real estate, or other non-operating assets.
Financial Period Consistency
Use the same TTM definition and period-end date for all targets, backed by the latest 12 monthly statements. Reconcile differences in revenue recognition for deposits, deferred revenue, and milestone billing.
Operating Economics
Once the reporting periods align, check whether managers can sustain reported earnings. Request the org chart, employment terms, approval limits, and retention plan.
Verify who controls pricing and key customer relationships, whether manager pay matches market rates, and what post-closing retention costs relate to the seller’s duties. Use these adjustments to normalize earnings and assess comparability - not to change EV/revenue directly. Management depth alone does not justify a higher multiple.
Owner-Dependent Business With Recurring Revenue (Hypothetical)
This profile tests whether recurring revenue will continue after the seller exits.
Industry and Revenue Band
In Kumo, filter by the same sub-industry and revenue band. Then add keywords such as “recurring,” “subscription,” or “contracted.” Use “absentee,” “fully staffed,” or “manager in place” only to isolate manager-led comps within that peer group.
Enterprise Value Basis
Use earnings only to estimate what it would cost to replace the seller’s work. Keep that adjustment out of EV ÷ revenue.
Financial Period Consistency
Match the financial period and accounting method across all comps. Use “Date Added” only to flag stale listings.
Operating Economics
Check whether customers renew because of the service or the owner’s personal involvement. Review retention records, renewal terms, and contract transfer provisions to judge whether the revenue can transfer to a new owner. Drop any target that fails this test before calculating EV ÷ revenue.
Calculate Enterprise Value-to-Revenue Multiples
Revenue multiple = Enterprise Value ÷ Annual Revenue. This shows how much enterprise value a buyer pays for each $1 of annual revenue.
First, confirm what the quoted price covers: equity, operating assets, or enterprise value explicitly identified in the listing. If it’s an equity price, add verified debt and agreed debt-like obligations, then subtract applicable cash under the deal terms. Review equipment financing, shareholder loans, unpaid taxes, and lease obligations separately from ordinary operating liabilities.
Reconcile each component once. Don’t double-count inventory, equipment, real estate, or working capital.
Apply the same formula to these three hypothetical profiles; leave unknown inputs as Unresolved.
Target Stated Price Price Basis EV Adjustments Enterprise Value Revenue Base EV/Revenue Unresolved Questions Owner-operated business Unresolved Unresolved Debt, cash, and asset scope unresolved Unresolved Annual revenue amount and period unresolved Unresolved Does the price cover equity or assets? Is inventory included? Manager-led business Unresolved Unresolved Debt, leases, and working-capital treatment unresolved Unresolved Annual revenue amount and period unresolved Unresolved Which obligations transfer? What working-capital level is required? Owner-dependent recurring-revenue business Unresolved Unresolved Cash, debt-like items, and transaction scope unresolved Unresolved Annual revenue or ARR unresolved Unresolved Does reported revenue cover only the acquired business? Is it revenue or ARR?
Keep the underlying calculation unrounded, but display multiples to one decimal place. Label asking-price ratios indicative asking price ÷ revenue, not confirmed EV/Revenue. Label incomplete EV bridges provisional.
Use revenue multiples to screen deals, not price them. When earnings are negative or unavailable, revenue is only a screening tool. Check EBITDA, SDE, margins, cash burn, and working-capital intensity before treating a low multiple as attractive. Next, align revenue periods and accounting methods so you compare matching financial bases.
Align Revenue Periods and Accounting Methods
Before comparing EV-to-revenue multiples, put revenue on the same basis for every target. Once you’ve identified EV and revenue, use the same revenue window and cutoff date across targets. Record the valuation date separately.
Use historical revenue for the main comparison, and keep annualized and projected figures separate. Confirm whether each target uses cash, accrual, or modified-basis accounting.
For ASC 606 reconciliation, request sales ledgers, accounts receivable and deferred-revenue schedules, and customer contracts. Use these records to reconcile reported revenue with satisfied performance obligations before normalizing revenue.
Check principal-versus-agent treatment to confirm whether revenue should be reported gross or net. Exclude unusual revenue only when invoices, contracts, or correspondence support the adjustment. Keep reported figures alongside all documented adjustments.
Use this standardized revenue base for the next comparison of growth, margins, and revenue quality.
Compare Business Economics and Set Diligence Priorities
Once revenue is standardized, compare the business behind the multiple. A lower revenue multiple doesn’t automatically mean a better deal. If enterprise value (EV) or revenue hasn’t been verified, leave the multiple unavailable.
Compare Growth, Margins, and Revenue Quality
Review at least 3 years of annual data, plus trailing twelve-month (TTM) revenue, gross margin, EBITDA or SDE, operating expenses, and cash flow. Use SDE for owner-operated deals and EBITDA for manager-led deals, accounting for market-rate management compensation. Businesses with similar revenue can generate very different cash flow.
| Factor | Effect on Multiple and Comparability | Required Diligence Evidence |
|---|---|---|
| Growth and margin | Sustained organic growth and stable margins can support a premium; one-time spikes or price increases alone shouldn’t | Monthly sales by customer and product for at least 36 months; price and volume bridge; product-level margin reports; inventory, labor, and freight records |
| Recurring revenue, retention, and churn | Contracted or repeat revenue can make sales more predictable; churn or nontransferable contracts reduce revenue quality | Customer contracts; renewal rates; cohort analysis; monthly recurring revenue reconciliation |
| Customer and supplier concentration | Dependence on a few customers or suppliers increases downside risk and may limit comparability | Customer revenue by year; top-10 concentration; vendor spend analysis; supplier agreements; change-of-control provisions; payment terms |
| Seller dependence | Reliance on the seller’s relationships or labor makes comparison with independently managed businesses harder | Owner activity log; payroll plan; customer contacts; transition agreement |
| Geography and lease obligations | Local demand, labor markets, rent, and assignment restrictions can affect cash flow | Revenue by location; permits; demographic data; workforce information; lease, amendments, renewal options; rent schedule; landlord consent requirements |
| Licensing and regulation | Transfer restrictions or compliance costs can change diligence priorities and comparability | Licenses; inspection records; permits; violations; renewal dates |
| Verification quality | Missing periods or unsupported adjustments make the multiple unreliable | Tax returns; bank statements; general ledger; reconciliations; source schedules for add-backs |
Review Sector Benchmarks and Sample Size
After reviewing the business economics, compare the target with usable benchmarks. Check whether the price includes inventory, real estate, vehicles, or other nonoperating assets. The table below is a screening checklist - not a measured market-pricing benchmark.
| Benchmark Source | Observation Date | Industry and Size | Asking or Closed Price / Deal Value Basis | Revenue Period | Sample Size | Comparability Limitations |
|---|---|---|---|---|---|---|
| Screened Kumo listings | State the extraction date | Restrict to the same industry and revenue band | Asking enterprise value or clearly labeled deal value basis | Normalize all targets to the same period | Report included and excluded records | Listings may contain incomplete, stale, seller-estimated, or inconsistent financial data |
| Broker or industry transaction study | State publication and data date | Confirm sector, revenue, and EBITDA or SDE range | Closed transaction price, if available; confirm EV or equity value | Identify fiscal, trailing, or projected period | Report the usable deal count | May use confidential selection criteria or exclude unsuccessful processes |
| Buyer’s target financial records | State the statement cutoff | Confirm operating model and scale | Reconcile proposed transaction EV | Same historical window | Count fully supported targets | Missing records prevent comparison |
Calculate medians only from observations with verified or clearly documented enterprise value and comparable revenue. Name the quartile method, such as the inclusive percentile method, and report the number of usable observations. Three targets offer a screening comparison, not a market benchmark. Don’t include hypothetical profiles in observed statistics.
Rank Targets by Comparability
Rank targets for deeper diligence using verified data only. Use a 0–100 comparability score, not a valuation model. Apply these weights:
- Industry and business model: 25%
- Revenue band and scale: 15%
- Geography and market conditions: 10%
- Financial period and accounting consistency: 15%
- Operating model, including owner dependence and recurring revenue: 15%
- Data completeness and verification quality: 20%
Score each criterion from 0–100, multiply it by its weight, and add the results. Use the total to prioritize diligence - not to estimate value. Without supporting records, the earlier hypothetical profiles remain unranked.
Investigate discounts tied to weak margins, concentration, deferred maintenance, lease or licensing risk, owner dependence, stale financials, or excluded working-capital needs. Check whether premiums are supported by retention, growth quality, pricing power, management depth, transferable contracts, and normalized cash flow.
Rank Target Industry and Revenue Band Enterprise Value Comparable Revenue Revenue Multiple Financial Period Comparability Score Key Adjustment or Limitation Vs. Median Not ranked Owner-operated - hypothetical Not verified Unavailable Unavailable Unavailable Not verified Not assigned Verify replacement labor cost Not calculated Not ranked Manager-led - hypothetical Not verified Unavailable Unavailable Unavailable Not verified Not assigned Verify management costs Not calculated Not ranked Owner-dependent recurring-revenue - hypothetical Not verified Unavailable Unavailable Unavailable Not verified Not assigned Verify retention and transferability Not calculated
Conclusion: Use Revenue Multiples to Screen Deals
Filter for similar businesses, normalize enterprise value and revenue, and compare business economics. Before making an offer, validate earnings, cash flow, working capital, debt, taxes, and transaction structure.
FAQs
What if I can’t find closely comparable deals?
Look beyond the same industry to businesses in related fields or those that operate in similar ways. SMB data is often scattered, so normalize financial metrics, such as revenue or earnings, to put comparisons on the same footing.
Use several comparable companies instead of relying on one benchmark for a more balanced valuation. Pair market comparables with income-based or asset-based valuation methods to make your assessment more accurate.
How should I compare seasonal businesses?
Don’t rely on simple monthly averages. They can give a misleading picture. Use multi-year averages to normalize earnings and account for fluctuations. Also factor in higher working capital needs during peak periods, including inventory, staffing, and marketing.
For valuations, include both peak and off-peak performance to reflect the full business cycle. Cross-check reported revenue trends against actual bank deposits to confirm that seasonal patterns line up with cash flow.
When should I prioritize earnings over revenue multiples?
Put earnings multiples first when assessing profitability and operating efficiency, especially for established businesses with steady, predictable income. For these businesses, profitability drives value.
Revenue multiples can help when profits fluctuate or margins differ, but they leave out cost structures, making them less reliable for valuation. Metrics like EBITDA or Seller’s Discretionary Earnings (SDE) offer a clearer view of cash flow and financial health.