

Codely v2.0 public release is here
Lorem ipsum dolor sit amet, consectetur adipiscing elit lobortis arcu enim urna adipiscing praesent velit viverra sit semper lorem eu cursus vel hendrerit elementum morbi curabitur etiam nibh justo, lorem aliquet donec sed sit mi dignissim at ante massa mattis.
- Neque sodales ut etiam sit amet nisl purus non tellus orci ac auctor
- Adipiscing elit ut aliquam purus sit amet viverra suspendisse potent i
- Mauris commodo quis imperdiet massa tincidunt nunc pulvinar
- Adipiscing elit ut aliquam purus sit amet viverra suspendisse potenti
What has changed in our latest release?
Vitae congue eu consequat ac felis placerat vestibulum lectus mauris ultrices cursus sit amet dictum sit amet justo donec enim diam porttitor lacus luctus accumsan tortor posuere praesent tristique magna sit amet purus gravida quis blandit turpis.
All new features available for all public channel users
At risus viverra adipiscing at in tellus integer feugiat nisl pretium fusce id velit ut tortor sagittis orci a scelerisque purus semper eget at lectus urna duis convallis. porta nibh venenatis cras sed felis eget neque laoreet suspendisse interdum consectetur libero id faucibus nisl donec pretium vulputate sapien nec sagittis aliquam nunc lobortis mattis aliquam faucibus purus in.
- Neque sodales ut etiam sit amet nisl purus non tellus orci ac auctor
- Adipiscing elit ut aliquam purus sit amet viverra suspendisse potenti
- Mauris commodo quis imperdiet massa tincidunt nunc pulvinar
- Adipiscing elit ut aliquam purus sit amet viverra suspendisse potenti
Coding collaboration with over 200 users at once
Nisi quis eleifend quam adipiscing vitae aliquet bibendum enim facilisis gravida neque. Velit euismod in pellentesque massa placerat volutpat lacus laoreet non curabitur gravida odio aenean sed adipiscing diam donec adipiscing tristique risus. amet est placerat in egestas erat imperdiet sed euismod nisi.
“Nisi quis eleifend quam adipiscing vitae aliquet bibendum enim facilisis gravida neque velit euismod in pellentesque massa placerat”
Real-time code save every 0.1 seconds
Eget lorem dolor sed viverra ipsum nunc aliquet bibendum felis donec et odio pellentesque diam volutpat commodo sed egestas aliquam sem fringilla ut morbi tincidunt augue interdum velit euismod eu tincidunt tortor aliquam nulla facilisi aenean sed adipiscing diam donec adipiscing ut lectus arcu bibendum at varius vel pharetra nibh venenatis cras sed felis eget dolor cosnectur drolo.
I use 5%–10% of annual revenue for services and 15%–20% for manufacturing as starting points - not closing targets. Before applying either range, I check the accounting rules and the buyer’s trailing 12-month average of normalized operating net working capital (NWC).
In this October 6, 2026 review, I compare seven sectors. The cited July 17, 2026 guidance does not provide a separate benchmark for every industry.
Quick Comparison
| Industry | Benchmark or context | Main cash-cycle check |
|---|---|---|
| Professional and business services | 5%–10% of revenue | Billing, collections, and payroll timing |
| Technology, SaaS, and IT services | No separate range; service guidance offers context for IT services | Customer prepayments, deferred revenue, and receivables |
| Retail | No separate range; public chains and SMBs differ | Inventory turns and supplier terms |
| Manufacturing | 15%–20% of revenue | Materials, work-in-process, and collections |
| Wholesale and distribution | No separate range | Inventory, receivables, and supplier payments |
| Trucking | No separate range; service guidance offers context | Fuel, payroll, collections, and factoring |
| Restaurants and consumer services | No separate range; some businesses operate with low or negative NWC | Customer payment timing and vendor balances |
My rule: <u>compare the accounting definitions before comparing percentages</u>. I keep public-company figures separate from SMB guidance, check source dates and sample coverage, and review overdue invoices, aging inventory, and stretched payables.
Then I use the target’s normalized history to set the closing peg - and model growth and seasonal cash needs separately. A low NWC ratio alone doesn’t tell you whether the business has enough cash.
1. Professional and Business Services
NWC as a Share of Revenue
Service businesses usually carry less inventory than product businesses. That means billing and collection timing drives NWC more than stock levels.
Kumo’s benchmark for service businesses is 5%–10% of annual revenue.
Source Date and Sample Size
The benchmark is dated July 17, 2026, and draws on 120,000+ deals sourced from thousands of brokers and marketplaces.
The headline ratio is a starting point. The accounting details need a closer look.
Accounting Definition
Review receivables, unbilled work, accrued payroll, and deferred revenue separately. Unbilled work can tie up cash when it grows faster than revenue.
For buyers, the key question is whether the ratio points to efficient collections or a delay in turning work into cash.
Working Capital Drivers and Acquisition Risks
Payroll often comes due before customer payments arrive. Track DSO and collections: growing receivables, overdue invoices, and billing delays can leave the business short on cash.
Check whether key customer relationships rely on the departing owner. Also assess whether the business can cover payroll and rent if collections slow. Low or negative NWC helps only when it reflects actual payment timing - not hidden problems.
sbb-itb-97ecd51
2. Technology, SaaS, and IT Services
NWC as a Share of Revenue
SaaS and IT services have different cash cycles. SaaS customers often pay before services are delivered, which can lead to negative NWC. IT services usually follow the service-business pattern described above, with collections lagging payroll.
Source Date and Sample Size
Kumo published its service-business benchmark on July 17, 2026. It provides no separate sample size for SaaS or IT services and no breakdown between public companies and SMBs.
Accounting Definition
Deferred revenue is a core SaaS adjustment because it can materially change operating NWC. Define how you'll treat it before comparing ratios or setting the closing peg.
Working Capital Drivers and Acquisition Risks
Check whether the working-capital peg matches the business’s cash cycle. For SaaS, watch renewal timing, refund exposure, and rising DSO. For IT services, focus on the gap between payroll timing and collections on billed and unbilled work.
This Excel Dashboard Can Improve Your Working Capital Analysis
3. Retail
Retail is the first inventory-heavy sector in this comparison. Inventory turns and supplier terms account for most of the working-capital gap.
NWC as a Share of Revenue
Large public retail chains can operate with low or negative NWC. SMB retailers, by contrast, usually need positive working capital to pay for stock and day-to-day operations. Unlike services, retail ties up cash in inventory before sales turn it back into cash.
Source Date and Sample Size
The latest source material, dated July 17, 2026, cites more than 120,000 deals but gives no retail-specific sample size.
That makes a clear working-capital definition especially important in retail deals.
Accounting Definition
For acquisitions, use operating NWC: include inventory and operating receivables, then subtract accounts payable and any agreed operating liabilities. Exclude cash and debt-like balances. Spell out these inclusions and exclusions in the purchase agreement so both sides calculate the closing true-up on the same basis.
Working Capital Drivers and Acquisition Risks
Inventory holds cash until it sells. Review inventory aging, Days Inventory Outstanding (DIO), and whether stock is growing faster than sales. Rising Days Payable Outstanding (DPO) can point to tighter treasury control. But if margins are shrinking, the business may be relying on vendors for funding.
Negative NWC is more likely to work over time when a retailer collects customer cash before supplier payments are due. Fast inventory turns and favorable supplier terms support that timing.
Set the closing peg using a trailing twelve-month average of normalized working capital to smooth seasonal swings. Adjust for obsolete stock before closing, and account for growth: higher sales usually require more working capital.
4. Manufacturing
Manufacturing needs more working capital than services because materials and production use cash before delivery. Like retail, it ties up cash in inventory - but that commitment starts before production, and cash returns only after the sale.
NWC as a Share of Revenue
Kumo’s SMB acquisition guidance puts manufacturing NWC at 15%–20% of annual revenue, based on a trailing twelve-month average of normalized working capital.
Source Date and Sample Size
The source was published on July 17, 2026, and lists no sample size. Treat the range as a reference for acquisition diligence.
Accounting Definition
Use operating NWC: add receivables and inventory, then subtract payables. Exclude cash and debt-like balances, such as accrued interest or dividend payables.
This definition matters because manufacturing values are most sensitive to inventory mix, production stage, and collection timing.
Working Capital Drivers and Acquisition Risks
Review the aging of raw materials, work-in-process, and finished goods separately. If inventory grows faster than sales, purchasing or forecasting may be off. If receivables grow faster than revenue, collections may be under strain. Check overdue invoices and obsolete inventory before accepting closing values.
Track cash conversion cycle = DIO + DSO − DPO to measure how long cash stays tied up. Compare several years with trailing twelve-month results to distinguish seasonal inventory builds from worsening performance. Look closely at longer supplier payment terms when margins are falling: they may point to cash pressure rather than efficiency.
5. Wholesale and Distribution
Wholesale and distribution sits between manufacturing and retail. Inventory matters, but collection timing and supplier terms often drive the working capital cycle.
NWC as a Share of Revenue and Source Coverage
The supplied sources include no wholesale-and-distribution benchmark, benchmark date, or distributor-specific sample size. Manufacturing ranges of 15%–20% of revenue and service-business ranges of 5%–10% offer loose context - not targets. The sources cover more than 120,000 deals across hundreds of brokers and marketplaces, but that coverage does not establish a distributor benchmark.
Accounting Definition
Use normalized operating NWC, with cash and debt-like items treated separately. Align inventory reserves and supplier balances across companies. Otherwise, reported NWC may reflect accounting policies rather than how the business runs. Compare normalized operating balances as a share of revenue, not raw reported NWC.
Working Capital Drivers and Acquisition Risks
Review DSO, DIO, and DPO together to assess inventory turnover, collections, and supplier payment timing. Check whether suppliers could tighten payment terms after closing, increasing the working capital needed. Longer payable periods can support operations, but stretched payments may point to cash flow strain.
Stress-test whether cash and collections can cover payroll, rent, and supplier payments if sales weaken. Without normalization, the mix of inventory, receivables, and payables can make distributor working capital easy to misread.
6. Trucking
NWC as a Share of Revenue
Trucking works more like a service business than an inventory-heavy business. The only available benchmark is the July 17, 2026 service-business range of 5%–10% of annual revenue. There’s no trucking-specific sample, so treat that range as context, not a trucking target. Receivables timing matters more than inventory.
Accounting Definition
Exclude cash and debt-like liabilities from NWC. Factoring can make balance-sheet NWC look artificially low. To estimate operating NWC, add factored receivables back to accounts receivable so the figures reflect the underlying collection cycle.
Normalize factoring before using the benchmark.
Working Capital Drivers and Acquisition Risks
Fuel, driver wages, and maintenance need cash before customers pay, often 30 to 60 days later. Factoring can bridge this gap, but its fees reduce EBITDA.
For the closing peg, use a trailing 12-month average of normalized NWC, adjusted for factoring. Stress-test whether the business can cover fuel and payroll if collections slow or fuel costs rise.
7. Restaurants and Consumer Services
NWC as a Share of Revenue
Restaurants often operate with low or negative NWC: customers pay at the sale, while suppliers may offer 15–30-day payment terms. There’s no restaurant-specific benchmark, so treat the 5%–10% service range as context only.
The same logic applies to other businesses that collect cash before providing service. For consumer services, the billing model shapes NWC: prepaid subscriptions and deposits lower it, while invoiced services increase it. That makes how you account for liabilities more important than the headline ratio.
Source Date and Sample Size
Kumo’s July 17, 2026 SMB benchmark covers more than 120,000 deals. Source provides context on public-company patterns but no restaurant-specific range.
Accounting Definition
To compare operating NWC, include usable inventory and operating receivables, then subtract accounts payable and customer prepayments, including gift cards, deposits, and deferred revenue.
Agree on these accounting treatments before comparing targets. Customer prepayments remain liabilities until redeemed or earned.
Working Capital Drivers and Acquisition Risks
For restaurants, compare inventory turnover with payable aging. This helps distinguish low NWC driven by efficient operations from low NWC driven by delayed vendor payments.
For other consumer services, separate prepaid revenue from unpaid invoices. Then check whether the business would still have enough cash for payroll and rent if sales slowed. In this sector, the operating definition matters more than the raw number.
Working Capital Definitions and Comparison Limits
The industry ranges above are useful only when businesses are measured on the same basis. Compare definitions before percentages: broad NWC, source-defined non-cash NWC, and transaction NWC measure different things. Removing cash alone doesn’t create a closing target. Transaction NWC also excludes debt-like balances and other non-operating items. Here’s how those definitions affect the comparison.
| Measure | Included assets | Included liabilities | Cash treatment | Debt treatment | Revenue basis | Appropriate use |
|---|---|---|---|---|---|---|
| Balance-sheet NWC | All current assets | All current liabilities | Included | Current debt included | Annual or TTM revenue only when expressed as a revenue share | General liquidity screening |
| Source-defined non-cash NWC | Current assets excluding cash, subject to source rules | Current liabilities, subject to source rules | Excluded | Source-dependent | Annual or TTM revenue, per source | Source-consistent comparisons |
| Operating NWC / transaction NWC | Normalized operating receivables, inventory, and eligible prepaids | Agreed operating payables and accruals | Typically excluded | Excluded | Annual or TTM revenue for ratios; closing peg in dollars | Acquisition pricing and closing adjustments |
Financial institutions aren’t comparable: cash works like inventory, and interest-bearing assets and liabilities drive their cycles.
With the definition settled, look at the balance-sheet details.
Treatment of Cash, Debt, and Other Balances
Follow the source rules or purchase agreement when treating prepaids, accrued expenses, taxes, related-party balances, customer deposits, and deferred revenue. Transaction NWC may also exclude accrued interest, dividends payable, and similar debt-like items.
Check whether balances reflect period-end figures or trailing twelve-month averages, and whether revenue is annual or TTM. For pricing, base the peg on normalized average NWC - not a closing-date snapshot.
Public-Company vs. SMB Accounting
Cash- or tax-basis SMB records and inconsistent accruals can skew comparisons with public-company reporting. Public-company ratios provide context, not acquisition targets. Reconcile the target’s accounts to a consistent accrual basis before assessing growth, seasonality, and customer terms. Review three to five years of history to separate recurring needs from anomalies.
Asset Quality and Negative Working Capital
A low ratio can hide weak assets or stretched payables. Two businesses with the same NWC-to-revenue ratio may face very different collection and inventory risks. Even positive NWC can include overdue receivables or obsolete inventory.
Check later collections, inventory aging, and write-downs. Use the quick ratio for another liquidity check. Negative operating NWC can work over time when customers pay first, but growing overdue payables may signal payment pressure. Use DSO, DIO, and DPO to separate operating efficiency from collection problems, excess stock, or delayed supplier payments.
Using Benchmarks to Assess an Acquisition Target
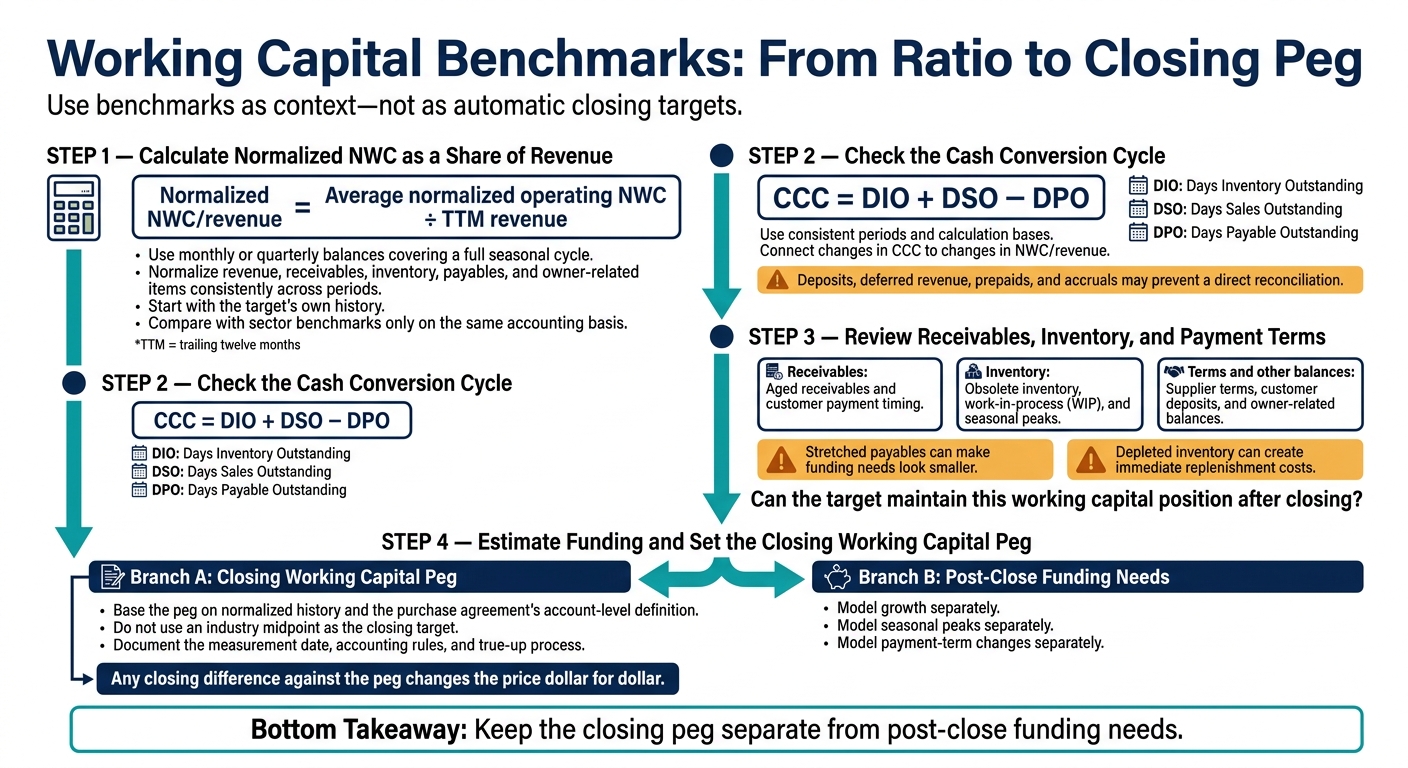
Working Capital Benchmarks: From Ratio to Closing Peg
Once the definition is set, use benchmarks to test the target’s cash cycle and funding needs.
Calculate Normalized NWC as a Share of Revenue
Calculate normalized NWC/revenue by dividing average normalized operating NWC by TTM revenue. Use monthly or quarterly balances that cover a full seasonal cycle. Normalize revenue, receivables, inventory, payables, and owner-related items consistently across periods.
Start with the target’s own history. Then compare its normalized NWC/revenue with the sector benchmark, using the same accounting basis.
Next, check whether the cash conversion cycle tells the same story.
Check the Cash Conversion Cycle
Calculate CCC = DIO + DSO − DPO using consistent periods. Then connect the change in CCC to the change in NWC/revenue. Keep the basis for DSO, DIO, and DPO consistent across periods. Deposits, deferred revenue, prepaids, and accruals may prevent a direct reconciliation.
Review Receivables, Inventory, and Payment Terms
Check whether the target can maintain its working capital position after closing. Review aged receivables, obsolete inventory, WIP, supplier terms, customer deposits, seasonal peaks, and owner-related balances.
Stretched payables can make funding needs look smaller. Depleted inventory, meanwhile, can leave the buyer with immediate replenishment costs.
Once you understand the operating cycle, translate it into a funding need and closing peg.
Estimate Funding and Set the Closing Working Capital Peg
Keep the closing peg separate from post-close funding needs. Benchmarks help inform the peg, but normalized history and the purchase agreement’s account-level definition determine it - not an industry midpoint.
Model growth, seasonal peaks, and payment-term changes separately. Document the measurement date, accounting rules, and true-up process. Any closing difference against the peg changes the price dollar for dollar.
Conclusion: Use Benchmarks as Context, Not Closing Targets
Cash gets tied up at different points in the working-capital cycle. Faster collections and customer prepayments can reduce the need for working capital - or turn it negative. These differences matter more than an industry benchmark alone. The source and accounting basis matter as much as the ratio.
Keep SMB data separate from public-company data. Public companies’ leverage with suppliers may not carry over to smaller acquisition targets. Treat both sets of figures as context unless their accounting bases match, and check each source’s sample size and observation date.
Once the data is cleaned up, test it against the target’s own cycle. Give the target’s normalized cash conversion cycle the most weight. Industry data should help frame funding assumptions, not replace target-specific evidence. Set the closing peg using the target’s normalized cycle and the working-capital accounts defined in the purchase agreement - not a sector average.
FAQs
What if my NWC ratio falls outside industry benchmarks?
Treat it as a diligence flag. Check the NWC target against normalized working capital - often a trailing 12-month average - and adjust for seasonality, one-off items, and accounting differences.
Pinpoint what’s driving the change: slower collections (DSO), inventory buildup (DIO), or stretched payables (DPO). Compare those measures with the company’s historical trend, not just peers. If working capital is structurally weak, negotiate the target and true-up/collar terms to protect pricing. [3]
How should I set an NWC peg for a fast-growing business?
Use a trailing 12-month average of normalized net working capital (NWC). Calculate it as operating current assets minus operating current liabilities, excluding cash and debt-like items unless the purchase agreement says otherwise.
If recent growth has improved operations, use a shorter period that reflects the new run rate. Remove one-time or nonrecurring items before calculating the average.
Compare the result with industry working-capital intensity, and document the exact calculation method so the post-close true-up process is clear.
How can I spot unsustainable negative working capital?
Efficient cash management isn’t the same as financial distress. Collecting customer payments before paying suppliers can reflect good cash timing. To tell the difference, compare receivables, inventory, and payables with the past 24 to 36 months, and check liquidity ratios against industry benchmarks.
Look for abrupt changes, a declining current ratio, supplier payment terms stretched before a sale, or worsening days sales outstanding, days inventory outstanding, and days payable outstanding. Cross-check bank statements and tax returns for one-off events or aggressive accounting.