

Codely v2.0 public release is here
Lorem ipsum dolor sit amet, consectetur adipiscing elit lobortis arcu enim urna adipiscing praesent velit viverra sit semper lorem eu cursus vel hendrerit elementum morbi curabitur etiam nibh justo, lorem aliquet donec sed sit mi dignissim at ante massa mattis.
- Neque sodales ut etiam sit amet nisl purus non tellus orci ac auctor
- Adipiscing elit ut aliquam purus sit amet viverra suspendisse potent i
- Mauris commodo quis imperdiet massa tincidunt nunc pulvinar
- Adipiscing elit ut aliquam purus sit amet viverra suspendisse potenti
What has changed in our latest release?
Vitae congue eu consequat ac felis placerat vestibulum lectus mauris ultrices cursus sit amet dictum sit amet justo donec enim diam porttitor lacus luctus accumsan tortor posuere praesent tristique magna sit amet purus gravida quis blandit turpis.
All new features available for all public channel users
At risus viverra adipiscing at in tellus integer feugiat nisl pretium fusce id velit ut tortor sagittis orci a scelerisque purus semper eget at lectus urna duis convallis. porta nibh venenatis cras sed felis eget neque laoreet suspendisse interdum consectetur libero id faucibus nisl donec pretium vulputate sapien nec sagittis aliquam nunc lobortis mattis aliquam faucibus purus in.
- Neque sodales ut etiam sit amet nisl purus non tellus orci ac auctor
- Adipiscing elit ut aliquam purus sit amet viverra suspendisse potenti
- Mauris commodo quis imperdiet massa tincidunt nunc pulvinar
- Adipiscing elit ut aliquam purus sit amet viverra suspendisse potenti
Coding collaboration with over 200 users at once
Nisi quis eleifend quam adipiscing vitae aliquet bibendum enim facilisis gravida neque. Velit euismod in pellentesque massa placerat volutpat lacus laoreet non curabitur gravida odio aenean sed adipiscing diam donec adipiscing tristique risus. amet est placerat in egestas erat imperdiet sed euismod nisi.
“Nisi quis eleifend quam adipiscing vitae aliquet bibendum enim facilisis gravida neque velit euismod in pellentesque massa placerat”
Real-time code save every 0.1 seconds
Eget lorem dolor sed viverra ipsum nunc aliquet bibendum felis donec et odio pellentesque diam volutpat commodo sed egestas aliquam sem fringilla ut morbi tincidunt augue interdum velit euismod eu tincidunt tortor aliquam nulla facilisi aenean sed adipiscing diam donec adipiscing ut lectus arcu bibendum at varius vel pharetra nibh venenatis cras sed felis eget dolor cosnectur drolo.
A business can look overpriced or underpriced just because of the date you pick. If I value a company at its busy-season peak or slow-season low, I can misread earnings, cash flow, debt, and working capital.
Here’s the short version:
- I should use normalized earnings, not one strong or weak period
- I need 24–36 months of monthly financials to spot repeat patterns
- I should set working capital using a trailing 12-month average, not the closing-date balance
- I should separate seasonal borrowing from long-term debt
- If cash moves a lot during the year, I should model value on a monthly or quarterly basis, not just annual figures
A few numbers show why this matters. Working capital often runs at 15%–20% of annual revenue for manufacturers and 5%–10% for many service firms. On $10 million in annual sales, that can mean a swing of $500,000 to $2 million depending on the business model and the time of year.
Seasonality is not the same as a multi-year cycle or a one-off event. If I mix those up, the price can be wrong and the deal terms can get messy.
| Issue | What I look for | What I do |
|---|---|---|
| Earnings | Peak or weak months | Normalize EBITDA or SDE across a full year |
| Cash flow | Inflows and outflows by month | Use monthly or quarterly DCF if timing matters |
| Working capital | Highs and lows during the year | Set a seasonally adjusted peg |
| Debt | Short-term borrowing spikes | Split seasonal debt from permanent debt |
| Diligence | Gaps between monthlys, tax returns, and bank records | Reconcile and explain each gap |
If I want to value the business instead of the calendar, I need to look at the full operating cycle, not one snapshot.
Value a Seasonal Business🏂 | Peak Business Valuation
sbb-itb-97ecd51
How Seasonality Distorts Financial Statements
Seasonality can throw off valuation when a buyer leans too hard on one reporting date.
Here’s the problem: a single balance sheet date might show a temporary high or low instead of the company’s normal operating position. When that happens, valuation gets skewed. The biggest swings usually show up in working capital and short-term financing.
Working capital, debt, and cash flow timing
Seasonal businesses often spend money before they collect it. They may need to build inventory, bring on staff, or ramp up operations ahead of the busy period. That creates a short-term funding gap, and many companies cover it with short-term borrowing.
Then the cycle flips. Once cash starts coming in during the busy season, that debt gets paid down. So cash balances and short-term debt can move up and down with the season, even when those shifts don’t reflect the company’s normal operating needs.
If a deal closes at a seasonal peak or trough, the working capital true-up can change the purchase price.
And this isn’t a small issue. The swing can be material. Manufacturing companies usually need working capital equal to 15% to 20% of annual revenue, while service-based businesses tend to run at 5% to 10%. For a business with $10 million in annual revenue, that points to a working-capital range of $1.5 million to $2 million.
Why one reporting date is not enough
One reporting date can’t show how much capital the business needs across the full operating cycle. A better approach is to set target working capital using a trailing twelve-month average, then compare that figure with industry benchmarks.
The point is simple: measure normal operating needs, not a seasonal spike or dip.
That’s why buyers normalize earnings and cash flow before applying valuation multiples.
How to Normalize Earnings and Cash Flow
Reported financials tell you what happened. Normalized financials tell you what the business can earn and generate in cash on a recurring basis.
For seasonal businesses, that difference can be big. Timing alone can make results look stronger or weaker than they are. Normalization fixes that problem and gives you an earnings base you can actually use for valuation.
Build a monthly view of performance
Start with monthly financials. Then review revenue, gross margin, EBITDA, and operating cash flow across time.
That monthly view helps you see three things:
- How big each swing is
- When it happens
- Whether it repeats
If the same months are strong or weak year after year, you can model that pattern with some confidence. But if a spike or drop shows up only once, treat it as a nonrecurring item, not part of the baseline.
Adjust reported results for recurring and temporary items
Once the monthly picture is clear, go line by line and ask a simple question: does this reflect normal operations?
That’s the whole point. You’re trying to isolate recurring earnings power and normal cash generation, not iron out every bump in the road. Some changes are just part of the business and should stay in the numbers.
Avoid using a straight historical average if the business has changed in a meaningful way. If performance improved more recently, a shorter normalization window usually makes more sense.
Present the adjustment bridge clearly
Each adjustment needs to be documented and explained. A clean bridge from reported results to normalized results makes the analysis easier to follow and cuts down on back-and-forth in due diligence.
Here’s a simple way to frame that bridge:
| Adjustment Area | Review | Why It Matters |
|---|---|---|
| Revenue | Monthly peaks, troughs, and isolated spikes | Separates seasonality from one-time events |
| Gross margin | Recurring changes in margin by month | Shows whether margin swings are seasonal or structural |
| EBITDA | Temporary or nonrecurring expenses | Helps estimate normalized earnings |
| Operating cash flow | Timing differences tied to seasonality | Clarifies normal cash generation |
The finished view should show the earnings and cash flow a buyer can underwrite in a normal year. That normalized base is then used in the multiple and DCF methods that follow.
How to Adjust Valuation Methods for Seasonal Businesses
Once you've normalized earnings, use those figures the same way across each valuation method. If you switch back to raw numbers in one model and normalized numbers in another, the whole exercise starts to wobble.
Apply normalized earnings to market multiples
Use market multiples on normalized EBITDA or SDE, not an unadjusted trailing 12-month number.
That matters because a raw trailing figure can overstate or understate performance if the period catches the business at the wrong point in its seasonal cycle. Normalized earnings give you a cleaner base for comparison.
Model seasonal cash flow timing in DCF and separate seasonal borrowings from permanent debt
When the timing of seasonal cash flow changes value, build the DCF on a monthly or quarterly basis.
A yearly model can blur what's happening inside the business. If cash comes in heavy during one part of the year and drains out during another, that timing affects risk, funding needs, and value. The same timing discipline should also flow into the working-capital peg.
You should also separate seasonal borrowings from permanent debt. Short-term borrowing tied to inventory builds or other seasonal patterns shouldn't be treated the same way as long-term debt that stays in the business year-round.
Separate seasonal working capital from permanent needs
Set the working capital peg at normalized operating needs at closing, not at a seasonal peak or trough.
In plain English, the peg should reflect what the business normally needs to run, not a temporary high or low caused by the calendar. Also exclude non-operating items from the peg, such as:
- Cash
- Accrued interest
- Dividend payables
Handle those through separate true-ups. And to avoid turning small seasonal moves into a fight at closing, use a collar so minor swings don't trigger adjustments.
Build a Buyer-Ready Seasonality Analysis
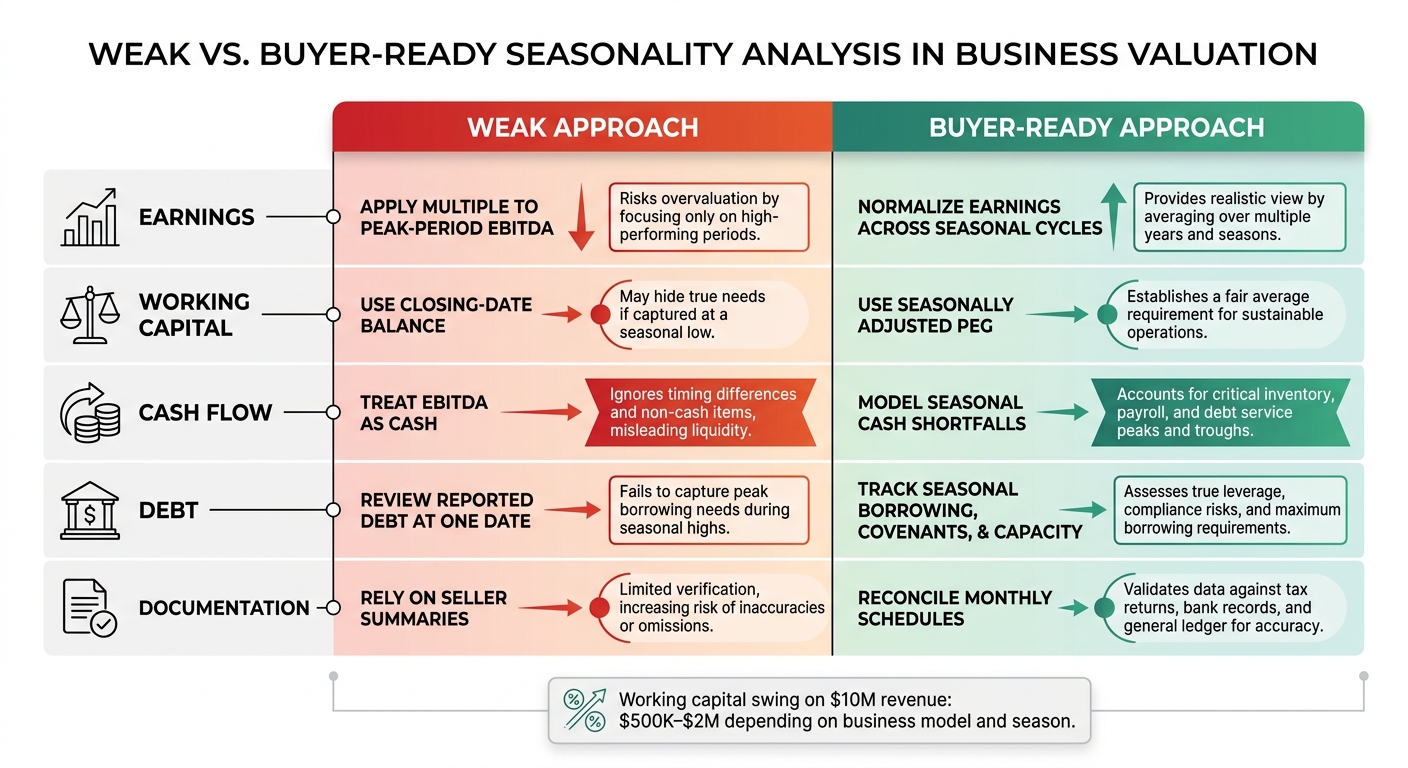
Weak vs. Buyer-Ready Seasonality Analysis in Business Valuation
What to prepare before pricing a seasonal deal
Buyer-ready diligence starts with full-year data. Seasonal businesses can look overpriced or underpriced if you judge them from one reporting date.
Ask for at least 24–36 months of monthly financial statements, along with schedules for:
- revenue
- gross profit
- operating expenses
- EBITDA
- working capital
- debt balances
Those monthly schedules should tie back to the annual financial statements, federal tax returns, and, when it makes sense, bank statements and the general ledger. If there are material differences, each one needs a clear explanation. That includes accrual timing, owner compensation adjustments, tax-basis accounting, and other timing issues.
If reported revenue doesn’t match tax-return revenue and no one can explain why, that’s a diligence problem - not a small math issue.
You’ll also want to map the operating reasons behind each repeat high and low point. That usually means looking at customer buying habits, inventory timing, staffing, promotions, holidays, weather, and project schedules.
Once the records are in place, the gap between a weak review and a buyer-ready one becomes pretty clear:
| Analysis area | Weak approach | Buyer-ready approach |
|---|---|---|
| Earnings | Apply a multiple to peak-period EBITDA | Normalize earnings across several seasonal cycles |
| Working capital | Use the closing-date balance | Use a seasonally adjusted peg |
| Cash flow | Treat EBITDA as cash | Model seasonal cash shortfalls, including inventory, payroll, and debt service |
| Debt | Review reported debt at one date | Track seasonal borrowing, covenants, and borrowing capacity over time |
| Documentation | Rely on seller summaries | Reconcile monthly schedules to tax returns, bank records, and the general ledger |
How Kumo can support early-stage opportunity review
Before the heavier diligence work starts, teams still need a fast way to find businesses that match a seasonal playbook. That’s where Kumo comes in.
Kumo helps acquisition teams shortlist seasonal businesses early by pulling listings into one place and surfacing opportunities through AI search, alerts, and analytics.
Conclusion: Value the business, not the season
With the diligence file in hand, the pricing takeaway is straightforward: value the business on normalized earnings across a full operating cycle, not on one reporting date.
A company that earns most of its cash in just a few months can still be a good acquisition. But the price has to reflect normalized earning power, and the deal structure has to account for what the slow season does to financing.
FAQs
How do I tell seasonality from a one-time event?
Review monthly financial data across two to three years. Seasonality shows up as a repeat pattern, like a revenue jump or drop that hits around the same time each year. A one-time event is different. It’s a one-off bump or dip, such as an asset sale, a government grant, or a one-time consulting project.
If the pattern isn’t obvious at first glance, use time series decomposition or moving averages. These methods help strip out short-term noise so you can see the underlying trend and spot the actual seasonal pattern.
When should I use a monthly DCF instead of an annual model?
Use a monthly discounted cash flow (DCF) model when a business has big seasonal revenue swings, like tourism or retail. Annual averages can blur what’s actually happening by smoothing income across the year, even when most of it lands in just a few months.
A monthly model gives you a much clearer picture. It shows when the business earns cash, how working capital moves through the year, and how costs such as inventory and staffing rise and fall with demand.
That matters because timing drives value in seasonal businesses. If cash piles up in peak months and tightens in slower ones, a monthly DCF will reflect that pattern far better than an annual model. The result is more accurate cash flow projections and a valuation that lines up more closely with how the business actually operates.
What should be included in a seasonally adjusted working capital peg?
Include operating working capital: accounts receivable, inventory, and other operating current assets, minus accounts payable and other operating current liabilities. Leave out cash, debt, and income tax accounts unless the deal says otherwise.
Set the target using 24 to 36 months of monthly data, not one year-end balance sheet. That gives you a cleaner view of day-to-day operations.
Use that monthly data to calculate:
- DSO
- DIO
- DPO
This helps the peg reflect normal operating levels instead of seasonal peaks or slow periods.